3D printing of digital elevation models: Difference between revisions
m (→Links) |
m (→Links) |
||
| Line 318: | Line 318: | ||
<references /> | <references /> | ||
=== | === Software === | ||
(needs to be completed) | |||
; | ; STL extraction from DEM | ||
* [http://www.bubblycloud.com/hills/ Hills] and [https://hackage.haskell.org/package/hills hill package] Command line tool for extracting STL files from *.ASC files. | * [http://www.bubblycloud.com/hills/ Hills] and [https://hackage.haskell.org/package/hills hill package] Command line tool for extracting STL files from *.ASC files. | ||
; Viewers | |||
* [http://freegeographytools.com/2009/3dem-website-is-gone-but-3dem-still-available-here 3DEM 3DEM Website Is Gone, But 3DEM Still Available Here]. (Windows) An older tool with a missing Website. Allows visualizing most DEM formats. | * [http://freegeographytools.com/2009/3dem-website-is-gone-but-3dem-still-available-here 3DEM 3DEM Website Is Gone, But 3DEM Still Available Here]. (Windows) An older tool with a missing Website. Allows visualizing most DEM formats. | ||
; Converters | |||
* [http://www.micromouse.ca/index.html AccuTrans3D]. Converter for Windows. For only $20 it can convert between '''lots''' of file formats | * [http://www.micromouse.ca/index.html AccuTrans3D]. Converter for Windows. For only $20 it can convert between '''lots''' of file formats | ||
=== Links === | |||
* [https://3dprint.com/141293/3d-printed-topographical-map/ Want to Create Your Own 3D Printed Topographical Map? It's Surprisingly Easy] by Clare Scott | Jul 7, 2016 | |||
; Height map Tutorials | ; Height map Tutorials | ||
Revision as of 21:18, 8 March 2017
Printing elevation models
This article describes how to create printable STL models from various kinds of terrain data (digital elevation models, DEM) that is available for free.
Producing STL models from terrain data can be similar to producing models from 3D scans since some digital elevation models (DEMs) also use point clouds.
This text is under construction and will need re-organizing. For the moment, I just take down notes of what I am playing with - 16:50, 3 March 2017 (CET).
Typical workflow
The outline of the workflow is the following:
- Get a model
- Translate it to STL (this may need passing through an intermediary format)
- Make the model manyfolded with a flat bottom (if the STL generator doesn't do this already)
- Repair the model with an STL editor, e.g. use Netfabb
- If the model represents a very small area you could consider smoothing the model. On the contrary, if it is larger consider reducing the triangles, e.g. using the free Meshlab program
- Crop in x,y,z axis if there is a need.
- Adjust the Z-axis. In some cases you might want to emphasize horizontal distances by a factor of 2, 3 or 4.
- Slice and print it
Digital elevation model formats
There are many formats used. Difference in resolution can be important. E.g. SwissALTI3D is only 2m meters wheras as Eu-DEM is 25 meters. On other important value are mean errors. Wikipedia has a good GIS file formats list that includes formats that can include DEM data. Acording to Wikipedia's Digital elevation model article, DEM can be represented as a raster (a grid of squares, also known as a heightmap when representing elevation) or as a vector-based triangular irregular network (TIN).
Below we just the list the ones we played with
| Name | File extension | Description | ||
|---|---|---|---|---|
| ESRI ASCII GRID | asc | A popular GIS specific exchange format. See Esri grid (wikipedia) | raster | |
| geoTIFF | tif or tiff | Annotations to the 2D TIFF format. See GeoTIFF (Wikipedia) | grid | |
| DXF | dxf | Autocad proprietary but many tools can import/export | vector | |
| XYZ | Mainly used in Chemistry | Vector (point clouds, each point has a coordinate) |
There are many datasets. Below are a few:
| Name | Resolution (x/y axis) | Mean errors (z)
depend on slope |
Data Source | |
| CGIAR-CSI STRM | 90m | |||
| ViewFinderPanoramas (VFP) | 30.92m | SRTM and ASTER GDEM | ||
| EU-DEM | 30.92m | (same as VSP) | ||
| DHM25 | 25m | 2-8m | Swisstopo | Prior to SwissALTI3D, based in essence on the 1:25000 maps. This data set is free |
| SwissALTI3D | 2m | Swisstopo | commercial dataset |
Using Terrain2STL oneline service to produce STL from 90m SRTM dataset
Terrain2STL is an online service that allows selecting a square on Google maps. From these coordinates it then will extract a region from the Nasa/cgiar-csi data and produce the STL. Quote: “Terrain2STL is a free-to-use service, but if you want to help support the site, donations are welcome. Terrain2STL creates STL files using the SRTM3 dataset from 2000, which has a resolution of about 90 meters on the equator.” (Terrain2STL home page, feb 2017)
It only will need some cropping and a little repair, e.g. something that Netfabb Studio can handle very well.
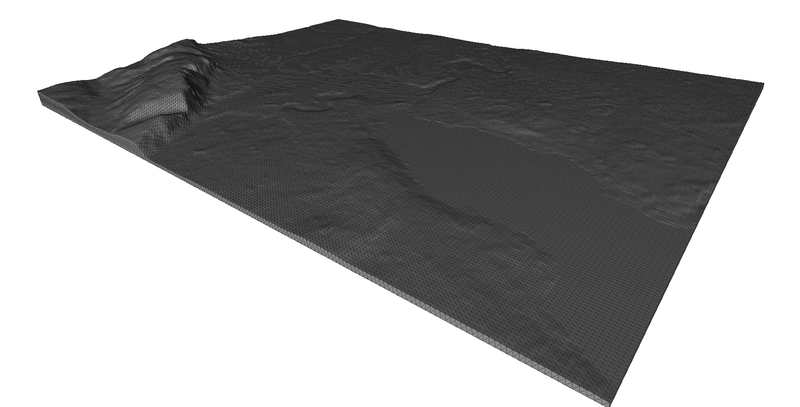
I tested this service and it works really well, e.g. I printed the Teide and Caldera Blanca volcanoes. The only caveat is the 90m resolution of the SRTM3 data set. The Caldera Blanca is a small 300m mountain on Lanzarote and did not come out in a very interesting way. The Teide (including its old huge caldera) created a fine enough model.
In conclusion, this is the easiest and fastest way to get going. Any beginner with a moderate amount of 3D mesh manipulation skills can do it. See the tips for slicer settings below.
In case you want some more control, and if you own a Linux system, you can use the hill program below which provides the same kind of results. While figuring out the coordinates and dimensions of your map takes more time, producing it is faster.
Produce STL from ASC SRTM data with the hills command line tool
Hills is another package that can generate 3D models of areas in STL format of the earth's surface using SRTM 90m elevation data from CGIAR-CSI (see http://srtm.csi.cgiar.org/).
This command line tool is programmed in Haskel and requires some installation. It's advantage with respect to phstl.py is that it can directly extract the right squares before doing the STL translation.
Installation under Ubuntu
To install Haskel and cabal
sudo apt install cabal-install
To install hills:
cabal update
cabal install hills
I found the program in ~/.cabal/bin/ so you might add this to your path:
- Edit ~/.bashrc
- Prepend /home/your_login/.cabal/bin to :$PATH, e.g.
export PATH=/home/_____/.cabal/bin:$PATH
Using hills
This method works with the dataset and tools described below. I did manage to create fairly quickly a decent STL model of the Geneva basin area - Daniel K. Schneider (talk) 16:41, 3 March 2017 (CET)
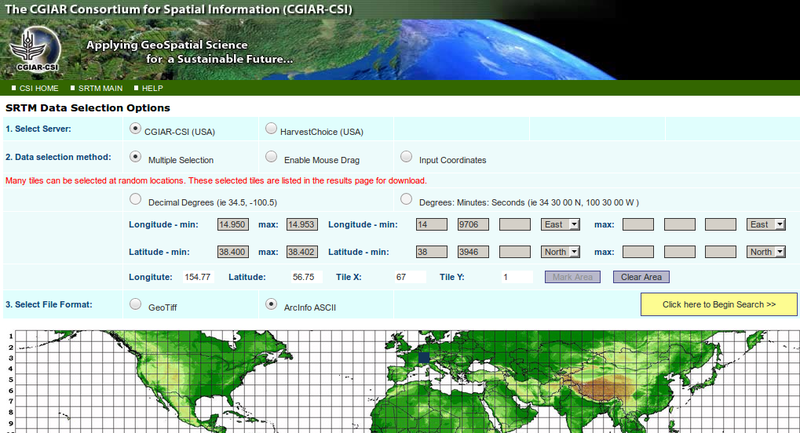
Get a data file from CGIAR-CSI. The earth is divided into squares. Make sure to take the ESRI ASCII (*.ASC version !).
- Either use the website where you can select the squares (see figure above)
- Or write down the square number and change the URL below. 38_03 represents parts of Western Switzerland, French Haut-Savoie etc. (are where University of Geneva is located)
wget http://srtm.csi.cgiar.org/SRT-ZIP/SRTM_v41/SRTM_Data_ArcASCII/srtm_38_03.zip
unzip srtm_36_01.zip
You now should have the following 150 GB file
150147952 Nov 24 2008 srtm_38_03.asc
From there you can extract rectangles that will be translated to STL models. You need the following information:
Get center coordinates
- Coordinates of the center, defined as decimal latitudes and longitudes. North of the equator is positive, south is negative. East from Greenwich is positive, west is negative. A good trick is to ask Google. E.g. longitude Geneva gives:
46.2044° N, 6.1432° E
Exactly what we need to extract terrain around geneva. If you cannot retrieve this directly from google search, you could use google maps or google earth and then click on a point. E.g. my building is around:
46.194644, 6.140955
Define rectangle size
- Hills requires an area in arcseconds, latitude first. Default values are 300x600. An arcsecond is 1/3600 of a degree and roughly represents 30 meters (it depends where you are). Therefore:
- 1km = 33
- 10km = 330
Since any decent STL tool allows you to cut away slices, you do not need to be very precise. Better take 50% extra terrain.
Define elevation
- By default, the model will start a sea level. Again, you easily could not define any elevation and just cut off a slice in the z-direction. But you may consider giving a height. Again, you simply can ask google, e.g. elevation geneva. Add enough height to cover the lowest point of your area.
Define scale
- By default, an area of 30x30km will come out much too big. You can change the size later, but by using the scale parameter you can make it smaller.
- 500 will reduce it by 1:500
Example using the three parameters. By default, hills will look at all the *.asc files that sit in the same directory.
hills --position 46.194,6.140 --dimensions 600x600 --base-altitude 300 --scale 1000 geneva.stl
generating for
 46-6-36N 6-3-24E to 46-16-39N 6-13-24E
 603 arcsec N/S x 600 arcsec E/W
 18.618km N/S x 12.865km E/W
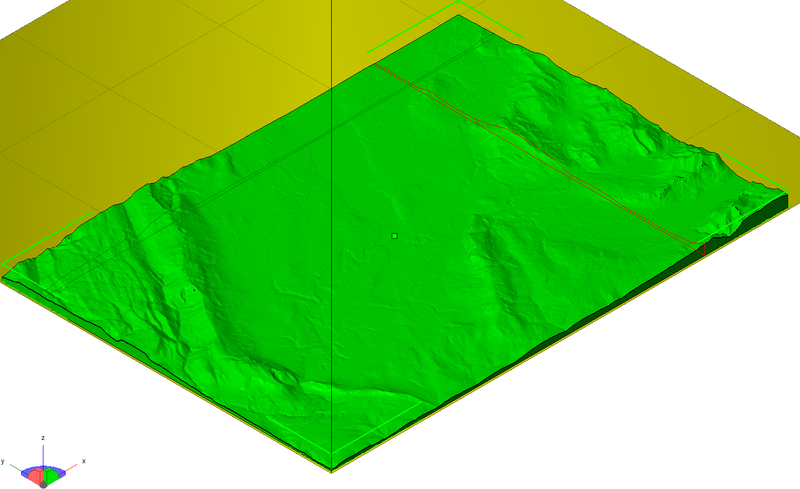
Here is the result as seen in Meshlab:

A second, better attempt that covered the whole was:
hills --position 46.194,6.140 --dimensions 1200x2400 --base-altitude 200 --scale 250 geneva-large.stl
The following will create a (roughly) 99 x 114 km area of the Geneva Lake - Mont Blanc area
hills --position 46.138,6.459 --dimensions 3200x5300 --base-altitude 150 --scale 600 geneve-mont-blanc.stl
generating for
 45-41-36N 5-43-21E to 46-34-57N 7-11-42E
 3201 arcsec N/S x 5301 arcsec E/W
 98.834km N/S x 113.781km E/W
For faster slicing and easier manipulation, it might require some triangle reduction (see below)
Mesh reduction
The data set includes a rather high resolution, i.e. a 90 meters grid and models of a smaller area have very manageable size. If you plan to print 100 x 100km areas with mountains, I suggest reducing triangles a bit, unless you got good hardware.
A good open source tool is Meshlab. Step 1
Menu File -> Import Mesh
Step 2
- Tick the Wireframe Icon on top
Step 3: Select the (maybe) best triangle reduction filter
Menu Filters -> Remeshing, simplification, and Reconstruction
Quadric Edge Collapse Decimation
Now in the small popup
- Tick "preserve Normal", maybe also "preserve topology"
- Enter target number of faces or enter a fraction, e.g. 0.25 as a minimum
- Apply
Then wait for a while. Verify the result. Sometimes a reduction can alter the overall geometry. The 25% reduced version of the Lake Geneva - Mont Blanc region still took a long time to slice.
After that make sure that you pass the mesh through a repair tool. Ideally you should that in fact three times. Before reducing, after reducing and after adjusting the Z-height (I usually multiply by 2).
You also could Meshlab to repair the triangle structure (mesh), but I prefer using Netfabb since it does not require any understanding :)
Creating STL from geoTIFF elevation maps with gdal and phstl.py
I do not know how well this works, since I gave up, see the "hills" program above as alternative.
Installation under Ubuntu 16x
Install the gdal library
sudo apt-get install libgdal-dev
sudo apt-get install gdal-bin
Test if something is there:
ogrinfo
Install the python interface (?)
sudo apt-get install python-gdal
Install the gdal python library
sudo easy_install gdal
Download the phstl.py script
- Either take the package from https://github.com/anoved/phstl , or
git clone https://github.com/anoved/phstl.git
Copy the script to some place that is in the PATH,e .g. ~/bin or /usr/local/bin
Transforming a geoTIFF to STL
Get an example file, e.g. from CGIAR-CSI[1] that provide elevation models for the whole world.
You can select a square in an area of interest. However this will create huge files. Most of Sicily sits in a square that is represented by a 72 GB tiff file. Translated this produced a 565 GB (!) STL File, which will be very difficult to handle.
Transform the tif into a non printable STL with phstl.py
Example:
phstl.py srtm_39_05.tif sicily.stl
Since the STL was too huge I did not pursue this. Maybe cropping the tif file before translating could be a solution, but which program can do it without deleting the height information data ?
Creating STL from XZY point clouds
(not done yet)
Some interesting data is available in the form of point clouds, i.e. points defined by their x,y,z coordinates. E.g. 3D scanners produce this kind of output.
I tried creating a model from the free DHM25 Swiss topology office. The download link is at the bottom a provides a zip file that includes a huge dxf files, and two much smaller *.asc and *.xyz files.
Here is the procedure:
- Import the xyz file
- Sample points
Filters -> Sampling -> Poisson-disk Sampling
- Tick Base Mesh Subsampling
- Try to go as high as you can, e.g. I just added the number of all vertices.
- The layer with the transformed data should be active
View -> Open Layer diaglog; If needed, hightlight poisson-disk samples
- Compute normals for the point set. Menu:
Filters-> Point Set -> Compute Normals for point set
- Tick "Flip normals w.r.t. viewpoints"
- Change number of neighbors from 10 to 20 or 30
- Tick "flip normals w.r.t. viewpoint" ??
- Apply (and wait for a long time if you forgot to sample or if you have a high sample)
- Then build the surface
Filters -> Point Set -> Surface Reconstruction : Poisson
- Set Octree depth = 10
The result of the poisson disk sample looked ok (I could recognize a nice 3D model showing off the Alps, but the final result looked like a bunch of dragons cut into pieces ... The last step somehow went wrong.
Slicer settings for digital elevation models
Printing 3D terrain models can be very frustrating. I had 2 print aborts before I managed to print my first bigger than 10x10cm model. In order to reduce the amount of these inevitable failed prints, we suggest a few strategies for PLA or another polymer that does not warp. Note that print properties of various PLA are different. Adapt to your filament.
Make sure that the model is error free
- Use an STL repair tool, e.g. Netfabb or builtin functionality.
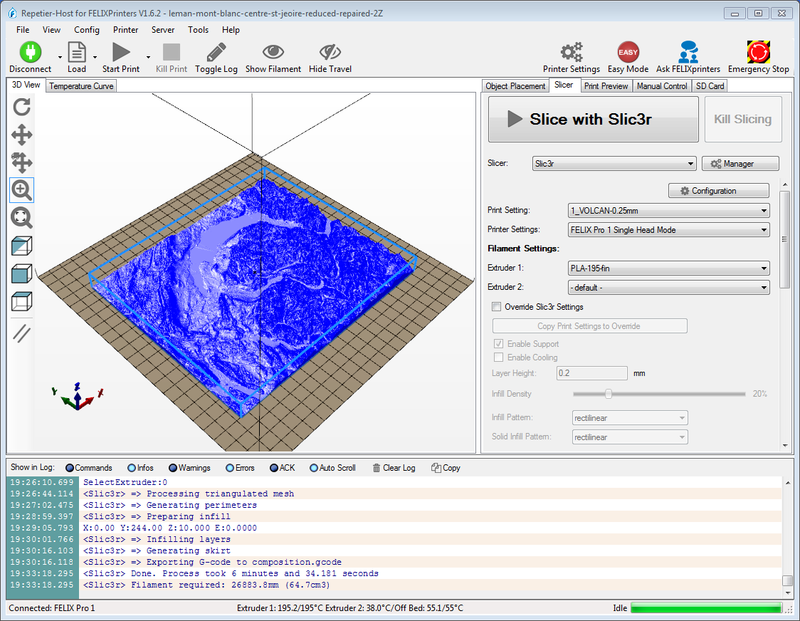
- Verify g-code, e.g. look at the print preview. If you controller or slicer does not allow this, install a tool that includes the same slicer and that can do it, e.g. Repetier host.I did encounter "freeky" parts like areas printed twice. These will make your print head getting stuck and as a result, a likely print abort. You can easily spot these areas in a gcode viewer, because they look very dense.
First layer adherence and warping
Even PLA can and does warp when you print large surfaces.To increase platform adherence and reduce warping, use the following strategies:
- Print the first (flat) layer slowly (about 30% of default speed, no more than 20mm/second
- Ventilator off for the first layer.
- Make the first layer fatter with extra extrusion about 125 to 150%
- Print it warmly (e.g. 205 degs. for PLA
- Print the other layers colder (about 195 degs.) You could go lower than that of course, but then you will have the risk that the flow will "dry" up when you print large infills, since bonding is not so easy at 20% infill and high speed.
- You also can consider adding glue or hairspray, but then you may have trouble getting the part off the print bed.
Filling and extrusion width
One of the problems with 3D terrain models is that in some printed areas will exceed their expected height (too much extrusion used for flat areas). The print head then will "dig" into the plastic and if you have a second print head it may want to rip off the whole print from the platform. Therefore you will have to rethink the way to print.
- 20% filling should be enough.
- Honeycomb patterns seem to lead to better results but may take more time for printing
- Reduce infill in other ways, e.g. in Slic3r, you could combine 2 layers and "only fill when needed"
- Verify default extrusion width. It should be set to the width of the nozzle or less, e.g. 0.35mm for a 0.35mm nozzle (For Lego I use 0.38mm).
- Set extrusion with to 0.9 or lower of the default width (see above).
- Do not print more than 2 top or bottom layers if possible. This may be a problem if you got large flat surfaces. Ideally, one should have a slicer that allows styles for various heights and sizes (like the Netfabb slicer we got for the infamous fabbster printer). Open source slicers cannot do this (unless I missed any improvement as of March 2017)
- Avoid PLA with too much paint inside. That type of PLA not only reduces print quality but also seems to expand more and could possibly include harmful chemicals.
Reduce print time
Even a small object can take a long time to print. E.g. it took 10 hours to print a 13x17x1 cm model of the Geneva basin using 0.2mm layers and settings I designed for printing Lego blocks.
- Consider using 0.25mm layers. For larger models, the result is OK. Use 0.2mm layers or less for small ones.
- Use all the filling strategies above.
- Use a controller that allows speeding up manually a print (e.g. Repetier Host) when you feel that everything goes fine. Some printers, e.g. my Felix Pro also allow this through its control screen.
- Standard speed can be fairly high, e.g. 60mm/s. If your slicer allows, reduce this for small areas. Consider also reducing the outer perimeter, e.g. I use 50mm/s.
- Use extra speed for filling, e.g. at least 80mm/s
- Disable any cooling tower or skirt (unless your object is very small).
Printing upside down
- I did not try this, but this strategy might allow printing sturdier objects with more infill and more layers on top and bottom. However I suspect that will need a good support structure (raft and or something "around"). Also, you cannot use much extra elevation since this would create difficult to print overhangs.
Bibliography, links and footnotes
Citations
- ↑ Quote: "The CGIAR is a global partnership dedicated to reducing rural poverty, increasing food security, improving human health and nutrition, and ensuring more sustainable management of natural resources. The Consortium for Spatial Information, CSI, is the CGIAR community of geo-spatial scientists that promotes and practices the application of spatial science to achieving these goals most effectively." http://www.cgiar-csi.org/ Feb 2017
Software
(needs to be completed)
- STL extraction from DEM
- Hills and hill package Command line tool for extracting STL files from *.ASC files.
- Viewers
- 3DEM 3DEM Website Is Gone, But 3DEM Still Available Here. (Windows) An older tool with a missing Website. Allows visualizing most DEM formats.
- Converters
- AccuTrans3D. Converter for Windows. For only $20 it can convert between lots of file formats
Links
- Want to Create Your Own 3D Printed Topographical Map? It's Surprisingly Easy by Clare Scott | Jul 7, 2016
- Height map Tutorials
- Make mountains in Blender from height maps For people who do know Blender
- 3d printing models of landscapes,
- 3d printing models of landscapes (instructables)
- Point cloud to STL tutorials
- XYZ to STL (point clouds to STL)
- Meshing point clouds
- Point Clouds to Mesh in “MeshLab”
- Cleaning Up Point Cloud Meshes in Meshlab For 3D Printing
- Heat map to STL tutorials
- Converting DEMs to STL files for 3D printing Explains how to use the Height Map Java tool described as thing 15276. It can convert heat maps.
- KMZ to STL
- [3D printing of digital elevation models From Digital Terrain Data to 3D Printing] by amagro, Instructables. Starting with map extraction from GADM, it uses Global Mapper ($500 payware) and Meshlab.
- General tutorials
- Reliefs Several tutorials by Gregor Luetolf. In German.
- [http://digitalcommons.cedarville.edu/cgi/viewcontent.cgi?article=1435&context=alum_books So, You W
ant to 3D Print a Landscape? An Outline of Some Methods] by Dylan J. McKevitt et al., Cedarville university. Best overall tutorial I found.
3D terrain data
- CGIAR-CSI. World-wide with a 90m resolution. Can export squares of gTIFF or AsCII. Explained above.
- USGS (USA). You can select a rectangle, select export, then GEM data.
- Terrain2SL All in one service (explained above)
- Swiss topo online map


