Flow chart
Jump to navigation
Jump to search
“A flowchart is a common type of diagram, that represents an algorithm or process, showing the steps as boxes of various kinds, and their order by connecting these with arrows. This diagrammatic representation can give a step-by-step solution to a given problem. Data is represented in these boxes, and arrows connecting them represent flow / direction of flow of data. Flowcharts are used in analyzing, designing, documenting or managing a process or program in various fields” ([http://en.wikipedia.org/wiki/Flow_chart Wikipedia, retrieved June 18 2010).
Flow charts explained

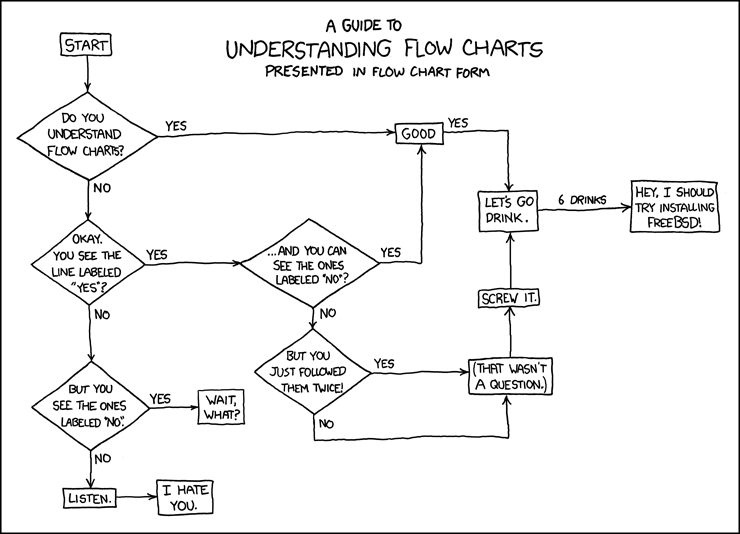
A guide to understanding flow charts: Source: http://xkcd.com, Copyright: Creative Commons Attribution-NonCommercial 2.5 License
Links
- Flow Chart (Wikipedia).