Graphviz
Definition
- Graphviz is an open source graph visualization software. It has several main graph layout programs, called layout engines.
- dot
- hierarchical drawings of directed graphs. The layout algorithm aims edges in the same direction (top to bottom, or left to right) and then attempts to avoid edge crossings and reduce edge length.
- neato
- spring model - attempts to minimize a global energy function, which is equivalent to statistical multi-dimensional scaling. See also fdp.
- fdp
- spring model layouts similar to those of neato, but does this by reducing forces rather than working with energy.
- sfdp
- multiscale version of fdp for the layout of large graphs.
- twopi
- radial layouts, The nodes are placed on concentric circles depending their distance from a given root node.
- circo
- circular layout - suitable for certain diagrams of multiple cyclic structures such as certain telecommunications networks
The GraphViz language and command line syntax
Command line syntax
See Command-line Invocation (at graphviz.org).
GraphViz includes several command line commands. The most imporant one is dot
The syntax pattern is:
cmd [ flags ] [ input files ]
Example:
dot -Tsvg GCF2.dot > GCF2.svg
Important flags:
- -Tformat
- -Tformat:renderer
- -Tformat:renderer:formatter
- Defines the output format. You also can choose from a renderer and change the default formatter for the renderer.
- See the list of output formats.
- Most important ones for web pages: png, svg, cmapx (client-side html map), imap (server-side html map) and vrml (partially supported)
- Most important ones for printing: png, svg, ps, pdf
- Most important ones for specialized clients: dot (reproduces the input, along with layout information for the graph), xdot (same with lots of additional information)
- -Klayout_engine
Examples:
- dot -Kneato is equivalent to running neato
- dot -Ktwopi runs the radial twopi engine
- -Gname[=value]
- Defines attributes of the graph like overlaps, fonts, etc.
- -ooutputfile
- specify the output file. Otherwise it's written to default output.
Format, rendering engines, formatters and layout engines
Here are some examples
- Client-side HTML maps
- creates client-side image maps (of course you'll have to attache URLS to either nodes or edges or both)
Example:
dot -Tcmapx -oyour_graph.map -Tpng -oyour_graph.png your_graph.dot
Then use something like:
<IMG SRC="your_graph.png" USEMAP="#mainmap" />
... [content of your_graph.map] ...
- SVG output using the default dot layout engine
Default use:
dot -Tsvg file.dot
Create SVG output using the cairo renderer and formatter
dot -Tsvg:cairo:cairo file.dot
- SVG output with the twopi engine
dot -Ktwopi -Tsvg GCF2.dot > GCF2.svg
- PDF output with the twopi or fdp layout engines
dot -Ktwopi -Tpdf GCF2.dot > GCF2.pdf
dot -Kfdp -Tpdf GCF2.dot > GCF2.pdf
- PNG output
Default use:
dot -Tpng
specifies PNG output produced by Cairo formatted using the GD library:
dot -Tpng:cairo:gd
- xdot output
- Pratical to see where nodes are being positioned so that you can manually change things
- Also useful with graphviz clients
Example:
dot -Ksfdp -Txdot conole-fill-taxonomy-edutechwiki-sfdp.dot > temp.xdot
Some Neato command line examples
Lists configuration
neato -v
List all formats your installation can produce
neato -Tformat:
PNG output without overlap
neato -Tpng -Goverlap=false GCF.dot > GCF.png
SVG output
neato -Tsvg GCF.dot > GCF.svg
neato -Tsvg -Goverlap=scale -Gfontsize=8.0 GCF.dot > GCF.sv
Graph files
Graph file syntax
Below is a semi-formal grammar (i.e. the real grammar simplified). See the official doc for a complete one.
Parentheses ( and ) indicate grouping when needed. Italic square brackets [ and ] enclose optional items. Vertical bars ¦ separate alternatives. Stuff in bold must be typed "as is", e.g. bold [ ... ] square brackets or graph
| graph | --> | (digraph ¦ graph) id {statement-list} |
| statement-list | --> | statement; statement; ... |
| statement | --> | attr-statement ¦ node-statement ¦ edge-statement ¦ subgraph cluster_xxx {...} |
| node-statement | --> | id [ attr-list ] |
| attr-statement | --> | (graph ¦ node ¦ edge) [attr-list ] |
| id | --> | id = id |
| attr-list | --> | id=val_id, id=val_id, .... |
| id | --> | String ¦ quoted string |
| edge-statement | --> | id (-- ¦ ->) id [attr-list] |
- Comments
Are C++ style, i.e. either /* ....*/, // or #
- Identifiers (id and val_id)
- Must start with a letter
- Unquoted strings only can contain [A-Z][a-z][0-9] and "_"
- Otherwise strings must be quoted
Graphviz attributes
See either (or both):
In addition.
- GraphViz Attributes (Haskell docs)
We we understood right (this is a disclaimer!)
- You may set these (most?) as global settings in the command line
- As global settings in a file at the graph level or for all nodes or for all edges.
- As "parameter" for node statements
- As "parameter" for edge statements
Also, some will not work with certain layout programs and there is interaction. I.e. sometimes it's quite difficult to figure out what given attributes will do. I found that pinning down nodes in given locations won't work with sfdp (or maybe I didn't figure out how to do this ...) - Daniel K. Schneider 13:46, 24 May 2010 (UTC).
- size
- defines the size of the output in inches
- Consult Wikipedia's papersize or ISO 216 articles for pratical tables that translate ISO (European) A,B,C formats to inches.
Example of a portrait A2 page:
size="34.4,16.5";
- ratio
- Is a crucial attribute for larger graphs that should fit on a given canevas size
Example:
- will try to fill a "page" defined by its size.
ratio="fill";
- page
- Defines multiple page outputs (only works with PS)
Example of A3 output (biggest page a typical laser printer can handle)
page="16.5,11.7"
- shape
- Defines the shape of a none
Example of a node redition:
- Remove shape (keep the text only), make it smaller:
node [fontsize=8,shape=none];
- overlap
- determines if and how node overlaps should be remove. There exist several alorithms
Examples:
overlap="false"
overlap="prism"
Edge and node attributes
Some attributes only apply to either nodes or edges
E.g.
node [fontsize=14,fontname="Arial",shape=none,nodesep=1,ranksep=2];
edge [arrowhead=normal,arrowsize=0.3,len=0.3]
Simple graphviz for mediawiki examples
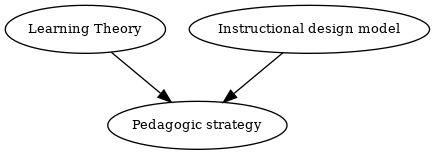
In this wiki, a directed graph that is represented like this (if you use the graphviz software as standalone program, you should remove the XML tags with are specific to the Graphviz mediawiki extension we are using here).
<graphviz>
digraph G4 {
            node [fontsize="10"];
            "Learning Theory" [URL="Learning theory"];
            "Pedagogic strategy" [URL="Pedagogic strategy"];
	    "Instructional design model" [URL="Instructional design model"];
            "Learning Theory" -> "Pedagogic strategy";
            "Instructional design model" -> "Pedagogic strategy"
}
</graphviz>
could render like that (yes this wiki has a graphviz extension, but we may not keep it for sure since it is somewhat CPU intensive)
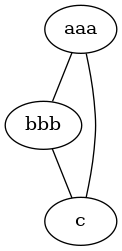
A simple non-directed graph (Notice: the XML attributes are ignored, worked once with an older version that is lost to humanity:
<graphviz>
 graph G1 {
    aaa -- bbb;
    bbb -- c;
    aaa -- c;
}
</graphviz>
gives:
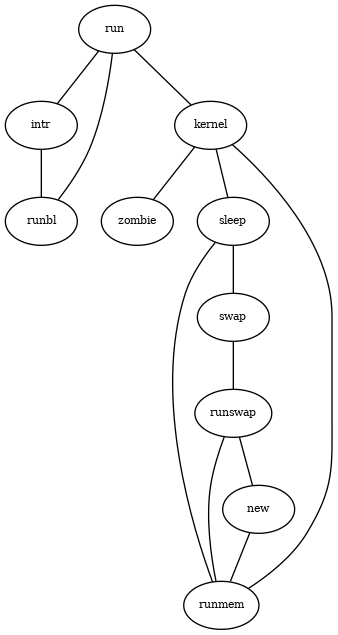
Or a more complex non-directed graph:
<graphviz border="frame" caption="G7 example" alignment="left" location="none">
graph G77 {
   node [fontsize="8"];
   run -- intr;
   intr -- runbl;
   runbl -- run;
   run -- kernel;
   kernel -- zombie;
   kernel -- sleep;
   kernel -- runmem;
   sleep -- swap;
   swap -- runswap;
   runswap -- new;
   runswap -- runmem;
   new -- runmem;
   sleep -- runmem;
}
</graphviz>
like this
Tools
See Graphviz - Graph Visualization Software (a longer list of interfaces, bindings, generators, scripts, etc.). Usually also needs graphviz software and the other way round. I.e. after installing Graphviz, you likely want to install a viewer or generator.
Mediawiki extensions
- Semantic Result Formats
- Extension:GraphViz MediaWiki extension (Tested and used in this wiki (Mediawiki 1.17 as of nov 2011). Earlier testing with Mediawiki version 1.11, Graphviz 2.16.1 on Solaris 10 (2008) and Mediawiki 1.15 + graphviz 2.20.2 under Ubuntu (From 2009 to 2011). Works fine !
- GraphViz Widget for Mediawikis (alpha status in Feb 2008).
- Extension:Graphical Category Browser for MediaWiki (>1.7x). This may be outdated.
- There is another Graphviz extension (by Gregory Szorc) located at http://web.archive.org/web/20071217001132/ or http://opensource.case.edu/svn/MediaWikiHacks/extensions/Graphviz/trunk/Graphviz.php (wayback machine version). This version features automatic pruning of Graphviz files on the filesystem and it can deal with other layout engines - tested in this wiki since 17:48, 25 May 2010 (UTC)
GraphiViz Viewers
- ZGRViewer. GraphViz/DOT Viewer
- iDot - Incremental Dot Viewer
- "canviz" - HTML5 and Javascript
Installation
- Windows
- Download of GraphViz software (source and Win/Linux binaries).
- The windows version has a *.msi installer. For VISTA, a command-line install is recommended, but I had to run the "click-on-it" install in order to have the gui tools through the command menu. Anyhow, it works fine both under VISTA and Win7
- Ubuntu 64-bit 14 LTS
- apt-get install graphviz
- However, sfdp still doesn't work (this is true since Ubuntu 10, years ago ...)
- Error: remove_overlap: Graphviz not built with triangulation library
... Manual installation/compilation could work, but I am too old for that and use my Windows PC instead ;)
- Ubunto 64-bit server
Download (as of May 2010):
wget http://www.graphviz.org/pub/graphviz/stable/ubuntu/ub9.04/x86_64/graphviz_2.26.3-1_amd64.deb
wget http://www.graphviz.org/pub/graphviz/stable/ubuntu/ub9.04/x86_64/libgraphviz4_2.26.3-1_amd64.deb
Install:
pkg -i libgraphviz4_2.26.3-1_amd64.deb
dpkg -i graphviz_2.26.3-1_amd64.deb
Since it is is likely that libraries are missing, type the following that should fix everything, i.e. retrieve missing stuff and install everything :)
apt-get -f install
Note: Again, you will have to do this manually since the graphviz in the official Ubuntu install is old (sfdp layout engine missing)
- Solaris
- For solaris, you can download a binary from sunfreeware.com plus these (check the version dependencies): cairo-xxx, freetype-xxx, glib-xxx, graphviz-xxx, pango-xxx, xrender-xxx, expat-xxx.
Tutorials and introductions
- Manual
- Graphviz - Graph Visualization Software Includes both introductions and manuals. However, first contact with the documentation is confusing, i.e. finding the appropriate pages for a problem is not so easy. Also, there is no beginners tutorial that simply shows solutions for typical use cases.
- The DOT Language
- Attributes for Nodes, Edges and Graphs
- Introductions
- Graphviz (Wikipedia)
- WikiSchool:Graphviz (Tutorial in German)
- Graphviz tutorial (in German). I like this one. Certainly the clearest introduction I found, although not complete.
- An Introduction to GraphWiz, September 10th, 2004 by Mihalis Tsoukalos, Linux Journal
- Examples
- See the official home
- In this wiki: Conole and Fill learning taxonomy
- Graphviz for UML
- UML Diagrams Using Graphviz Dot. Explains how to create UML class diagrams.