Orchestration graph
Introduction
Orchestration graphs are a formalism developed by Pierre Dillenbourg to model CSCL scripts and similar complex learning designs.
Orchestration Graphs depict the structure (what is done when by whom), the pedagogical rationale behind the activity flow, and the work flow created by data transfor-mations and student groupings (“social structure”). An “Orchestration Graph Engine”allows the teacher to run educational scenarios with her students following the activities as specified in the OG – or as modified real-time by her as she monitors their work– to provide input data and obtain output products. Finally, products and traces of the learning process are collected and processed; a stochastic model of the scenario uses these traces to predict (or confirm) learner states (Dillenbourg, 2015:95-100)[1]
Definition
An Orchestration Graph defines a pedagogical scenario in terms of learning activities at three levels class "plances": class, group and individual.
It is organized in a similar way as a GANTT chart, i.e. one has to read it from left to right. Each learning activity starts at given time and lasts for a given time.
Activity time can be short, intense and precise, e.g. in a class setting or last over days where students can engage asynchronously.
“Activities range from reading a text or watching a video, tocontributing ideas in a brainstorm, or experimenting with asimulation. They can take input data and social structures fromprevious activities and operators, and produce student products (such as students answers and designs), as well as detailed student trace data. See an example of a running activity. Activities (nodes) are connected through edges. These can contain pedagogical justifications (e.g., activity 1 is an advanced organiser for activity 2), learning analytics information (e.g.,student success is activity 1 is 34% correlated with/predictiveof success in activity 2), and operators.” [2]
Example
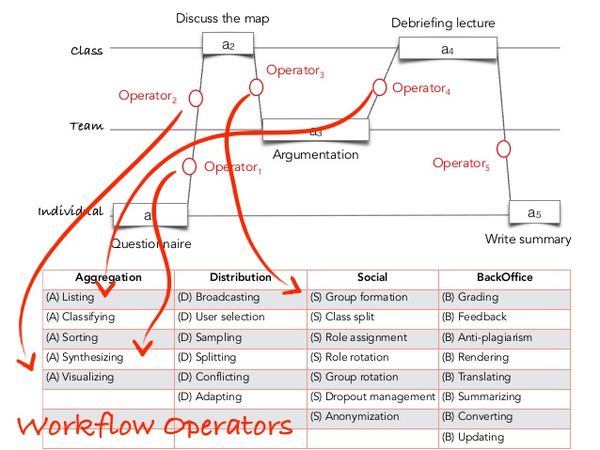
The following diagram taken from [ FROG: Embeddable tools for rich collaborative learning] talk, defines the ArgueGraph learning activity where learners first fill in a questionnaire, then discuss results that positions them according to their beliefs, then engage in group argumentation. After a defrieving they have to write a summary.

Each activity is usually supported by a tool. E.g. Argumentation can use a structured argumentation tool.
Activites can be connected by simple sequencing lines. However, most often the scenario requires workflow operators to be applied.
The following diagram shows that between activity a1 and activity a2, something must synthesize the information in the questionnaire. In order to create an argument (a3) after discussion (2), students must be organized in groups.

Software
- FROG (Fabricating and running orchestration graphs).
- More traditional software, e.g. learning management systems can be used to partly support some types of CSCL scripts, the same is true for workflow systems like LAMS.
Bibliography
Cited with footnotes
- ↑ Dillenbourg, Pierre (2015). Orchestration Graphs: Modeling scalable education. EPFL Press.
- ↑ Håklev, S., Faucon, L., Hadzilacos, T., & Dillenbourg, P. (2017). Orchestration Graphs: Enabling Rich Social Pedagogical Scenarios in MOOCs. In Proceedings of the Fourth (2017) ACM Conference on Learning @ Scale - L@S ’17 (pp. 261–264). New York, New York, USA: ACM Press. https://doi.org/10.1145/3051457.3054000