IBM Many Eyes v2: Difference between revisions
Jump to navigation
Jump to search
No edit summary |
No edit summary |
||
| Line 11: | Line 11: | ||
|field_last_release=2013/01/01 | |field_last_release=2013/01/01 | ||
|field_last_version=Beta | |field_last_version=Beta | ||
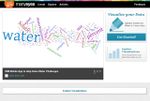
|field_description= | |field_description=A website where you can visualise data such as numbers, text and geographic information. You can create a range of visualisations including unusual ones such as “treemaps” and “phrase nets”. All the charts made in Many Eyes are interactive, so you can change what data is shown and how it is displayed. | ||
A website where you can visualise data such as numbers, text and geographic information. You can create a range of visualisations including unusual ones such as “treemaps” and “phrase nets”. All the charts made in Many Eyes are interactive, so you can change what data is shown and how it is displayed. | |||
Many Eyes is also an online community where users can create topical groups to organise, share and discuss data visualisations. You can sign up to receive notifications when there are new visualisations or data on topics you are interested in. | Many Eyes is also an online community where users can create topical groups to organise, share and discuss data visualisations. You can sign up to receive notifications when there are new visualisations or data on topics you are interested in. | ||
Only being able to use Many Eyes if your data and the visualisations can be shared publicly on the Internet. | Only being able to use Many Eyes if your data and the visualisations can be shared publicly on the Internet. | ||
|field_analysis_orientation=General analysis | |field_analysis_orientation=General analysis | ||
|field_data_analysis_objective= | |field_data_analysis_objective= | ||
|field_data_manipulation_type=Data visualisation | |||
|field_import_format= | |field_import_format= | ||
|field_export_format= | |field_export_format= | ||
| Line 26: | Line 24: | ||
|field_data_transformation_capabilities= | |field_data_transformation_capabilities= | ||
|field_analysis_type= | |field_analysis_type= | ||
|field_visualisation_type= | |field_visualisation_type=Sequential Graphic, Chart/Diagram, Map, Tag Cloud | ||
|field_tool_usability=easy to use | |||
|field_tool_usability= | |field_statistics_level=None | ||
|field_statistics_level= | |field_programming_level=None | ||
|field_programming_level= | |field_system_engineering_level=None | ||
|field_system_engineering_level= | |field_data_mining_models_level=None | ||
|field_data_mining_models_level= | |field_completion_level=Medium | ||
|field_completion_level= | |||
|field_last_edition=2014/03/04 | |field_last_edition=2014/03/04 | ||
}} | }} | ||


