Neural Designer
Neural Designer 2.9 (2015/05/20)
Developed by: Artelnics
License: Commercial&Closed source
Web page : Tool homepage
Tool type : Application software
The last edition of this page was on: 2015/05/22
The Completion level of this page is : High
The last edition of this page was on: 2015/05/22 The Completion level of this page is : High
SHORT DESCRIPTION
Neural Designer is a data mining application intended for professional data scientists.
It uses neural networks, which are mathematical models of the brain function that can be trained in order to perform tasks such as function regression, pattern recognition, time series prediction or auto-association.
The software provides a graphical user interface using a wizard approach consisting of a sequence of pages. It allows you to run the tasks and to obtain comprehensive results as a report in an easy way.
Neural Designer outstands in terms of performance. Indeed, it is developed using C++, has been subjected to code optimization techniques and makes use of parallel processing. It can analyze bigger data sets in less time.
TOOL CHARACTERISTICS
Usability
Tool orientation
Data mining type
Manipulation type
IMPORT FORMAT : CSV, Other, TSV, TXT
EXPORT FORMAT : Custom, Other
| Tool objective(s) in the field of Learning Sciences | |
|
☑ Analysis & Visualisation of data |
☑ Providing feedback for supporting instructors: |
Tool can perform:
- Data extraction of type:
- Transformation of type: Simple data transformation operations, Advanced data transformation operations, Mathematical transformation of data for analysis
- Data analysis of type: Basic statistics and data summarization, Data mining methods and algorithms
- Data visualisation of type: Chart/Diagram, Model (These visualisations can be interactive and updated in "real time")
ABOUT USERS
Tool is suitable for:
Required skills:
STATISTICS: Medium
PROGRAMMING: None
SYSTEM ADMINISTRATION: None
DATA MINING MODELS: Medium
FREE TEXT
| Tool version : Neural Designer 2.9 2015/05/20 (blank line) Developed by : Artelnics | 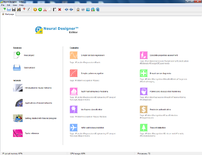
|
Contents
SHORT DESCRIPTION
Neural Designer is a data mining application intended for professional data scientists.
It uses neural networks, which are mathematical models of the brain function that can be trained in order to perform tasks such as function regression, pattern recognition, time series prediction or auto-association.
The software provides a graphical user interface using a wizard approach consisting of a sequence of pages. It allows you to run the tasks and to obtain comprehensive results as a report in an easy way.
Neural Designer outstands in terms of performance. Indeed, it is developed using C++, has been subjected to code optimization techniques and makes use of parallel processing. It can analyze bigger data sets in less time.
TOOL CHARACTERISTICS
| Tool orientation | Data mining type | Usability |
|---|---|---|
| This tool is designed for general purpose analysis. | This tool is designed for Structured data mining. | Authors of this page consider that this tool is easy to use. |
| Data import format | Data export format |
|---|---|
| CSV, Other, TSV, TXT. | Custom, Other. |
| Tool objective(s) in the field of Learning Sciences | |
|
☑ Analysis & Visualisation of data |
☑ Providing feedback for supporting instructors: |
Can perform data extraction of type:
Can perform data transformation of type:
Simple data transformation operations, Advanced data transformation operations, Mathematical transformation of data for analysis
Can perform data analysis of type:
Basic statistics and data summarization, Data mining methods and algorithms
Can perform data visualisation of type:
Chart/Diagram, Model (These visualisations can be interactive and updated in "real time")
ABOUT USER
| Tool is suitable for: | ||||
| Students/Learners/Consumers:☑ | Teachers/Tutors/Managers:☑ | Researchers:☑ | Organisations/Institutions/Firms:☑ | Others:☑ |
| Required skills: | |||
| Statistics: MEDIUM | Programming: NONE | System administration: NONE | Data mining models: MEDIUM |
OTHER TOOL INFORMATION

|
| Neural Designer start page.png |
| Neural Designer logo.png |
| Neural Designer |
| Commercial&Closed source |
| Artelnics |
| 2015/05/20 |
| 2.9 |
| https://www.neuraldesigner.com |
| Neural Designer is a data mining application intended for professional data scientists.
It uses neural networks, which are mathematical models of the brain function that can be trained in order to perform tasks such as function regression, pattern recognition, time series prediction or auto-association. The software provides a graphical user interface using a wizard approach consisting of a sequence of pages. It allows you to run the tasks and to obtain comprehensive results as a report in an easy way. Neural Designer outstands in terms of performance. Indeed, it is developed using C++, has been subjected to code optimization techniques and makes use of parallel processing. It can analyze bigger data sets in less time. |
| General analysis |
| Students/Learners/Consumers, Teachers/Tutors/Managers, Researchers, Organisations/Institutions/Firms, Others |
| Medium |
| None |
| None |
| Medium |
| Application software |
| Structured data mining |
| Data transformation, Data analysis, Data visualisation |
| Basic statistics and data summarization, Data mining methods and algorithms |
| Simple data transformation operations, Advanced data transformation operations, Mathematical transformation of data for analysis |
| CSV, Other, TSV, TXT |
| Custom, Other |
| Chart/Diagram, Model |
| Visualisation is interactive |
| easy to use |
| High |
Description
Neural Designer is a desktop application for data mining which uses neural networks, a main paradigm of machine learning.
Neural Designer follows an open core model by using OpenNN inside its learning engine. OpenNN is a popular open neural networks library written in the C++ programming language. It is hosted at SourceForge and licensed under the GNU Lesser General Public License.
The program supports both Windows and Linux platforms.
Neural Designer has two main windows, plus a calculation engine running in background. These allow you to (1) edit your settings, (2) perform computations, and (3) see your output. The next figure illustrates the flow of information in the software. The input here is a data set, and the output is a neural model.
The main components of Neural Designer are explained in detail below.
Neural Editor
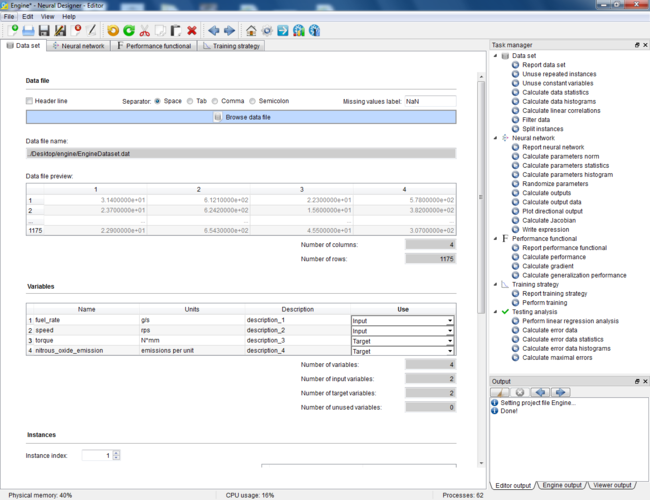
The editor lets you see and manipulate your settings. The next picture shows the main components of Neural Editor.
As we can see, Neural Editor has three panes:
- A data book with data set, neural network, performance functional and training strategy tabs. It contains the settings for all the components needed to solve a given application.
- A task manager with data set, neural network, performance functional, training strategy and testing analysis tasks. It contains a list of task for each component to be run by the engine
- An output pad for the editor, the engine and the viewer. Most information, warning and error messages will appear here.
Neural Engine
The engine runs tasks. That component does not have any window, but it executes processes in background. Tasks are called from Neural Editor. The results will show up in Neural Viewer.
As we have said, the engine is developed using the high performance neural networks library OpenNN.
Neural Viewer
The viewer writes a report displaying comprehensive and visual results from tasks. The following figure illustrates the Neural Viewer window.
Learning tasks
Two of the most important learning tasks that Neural Designer solves are function regression and pattern recognition. Both of them use data sets to construct the predictive model
Function regression
The objective here is to design a model which makes good predictions for new data, in other words, one which exhibits good generalization. This learning task is illustrated here through an example. In particular, we will model the performance of an engine.
The first step is to prepare the data set, which is the source of information for the function regression problem. Neural Designer contains different utilities for alerting on the presence of spurious data, detecting outliers, etc.
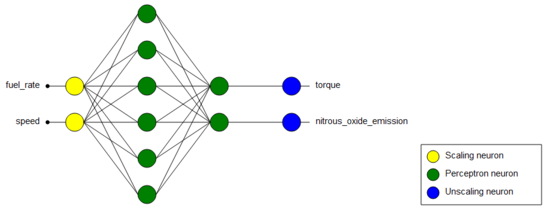
The neural network defines the model mentioned before. It must be trained in order to learn the underlying relationships between the outputs and the inputs. The next picture illustrates the neural network for this example.
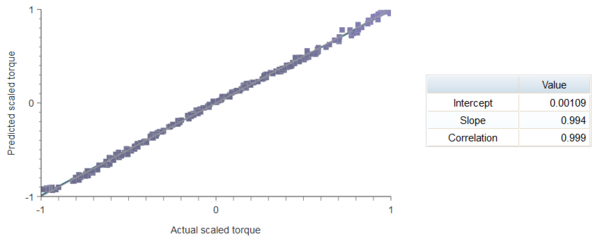
The neural network must be tested against data that it has never seen. A useful method for that is to perform a regression analysis between the outputs from the neural network and the corresponding targets in the testing data. The next picture shows the results of this testing method.
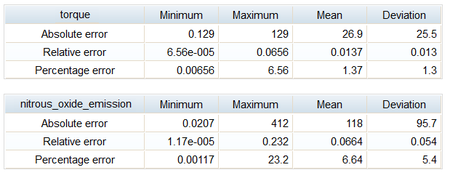
The statistics on the error data measure the minimums, maximums, means and standard deviations of the errors between the neural network and the testing instances in the data set. The next tables show the error data for the two targets in this example.
The last step is the production phase. Once the model has been tested, we can use it to predict the output. For that, we can use the explicit expression reported by Neural Designer, as illustrated below.
scaled_fuel_rate=2*(fuel_rate-0.6)/(314-0.6)-1;
scaled_speed=2*(speed-612.1)/(1801.8-612.1)-1;
y_1_1=tanh(0.930564-1.39538*scaled_fuel_rate-0.321324*scaled_speed);
y_1_2=tanh(0.87094+1.17317*scaled_fuel_rate-0.0562723*scaled_speed);
scaled_torque=(-0.172492-0.530289*y_1_1+0.876748*y_1_2);
scaled_nitrous_oxide_emission=(-1.1516+0.660648*y_1_1+1.70018*y_1_2);
torque=0.5*(scaled_torque+1.0)*(1784.3+176.7)-176.7;
nitrous_oxide_emission=0.5*(scaled_nitrous_oxide_emission+1.0)*(1774-0)+0;
Pattern Recognition
In this learning task, the aim is to design a neural network that can predict the correct class for given attributes. The central goal here is to design a model which makes good classifications for new data.
The first step is to prepare the data set. The data for this example has been taken from a breast cancer diagnosis application.
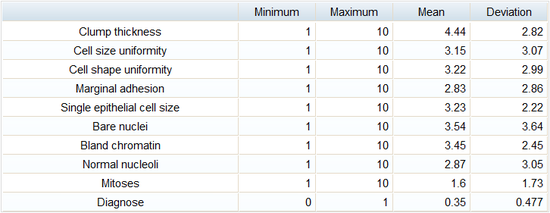
The next table depicts the basic statistics (minimums, maximums, means and standard deviations) of all variables.
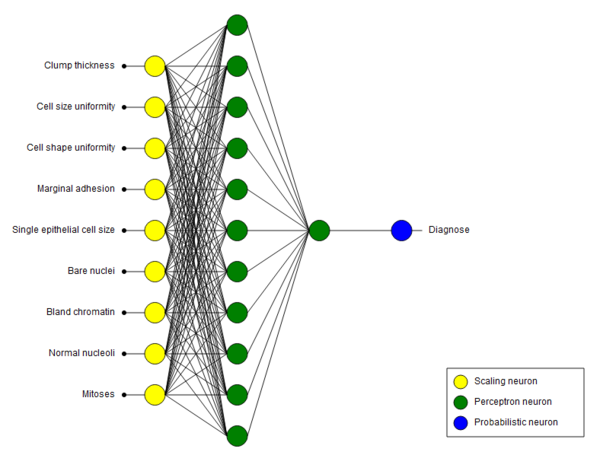
The second step is to represent the classification function. Neural Designer includes innovative neural network models for solving pattern recognition applications. A graphical representation of the network architecture in our example is depicted next.
The next step is to test the generalization performance of the trained neural network. Here we compare the values provided by this technique to the actually observed values. The next table shows the confusion matrix, which depicts the number of instances correctly and incorrectly classified.
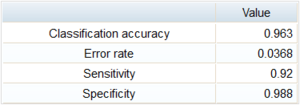
The following table depicts the binary classification performance parameters for the trained neural network on the testing instances.
The neural network is now ready to predict outputs for inputs that it has never seen.


