Methodology tutorial - empirical research principles
This is part of the methodology tutorial.
Introduction
- Global aim
- Acquire an understanding of some essential principles that define empirical research
- Learning goals
- Understand the central role of research questions
- Know the elements of a typical research process
- Understand "operationalization", i.e. the relationship between theoretical concepts and measures (observations, etc.)
- Be able to list some major measurement (data gathering) instruments
- Understand the concepts of reliability and validity and be able to challenge causality claims.
- Prerequisites
- None, but it is recommend to read Methodology tutorial - introduction module first
- Moving on
- Level and target population
- Beginners
- Quality
- There should be links to real research
Elements of a typical research cycle
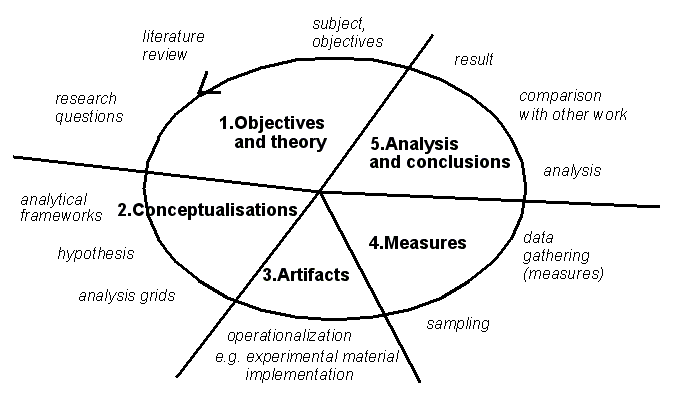
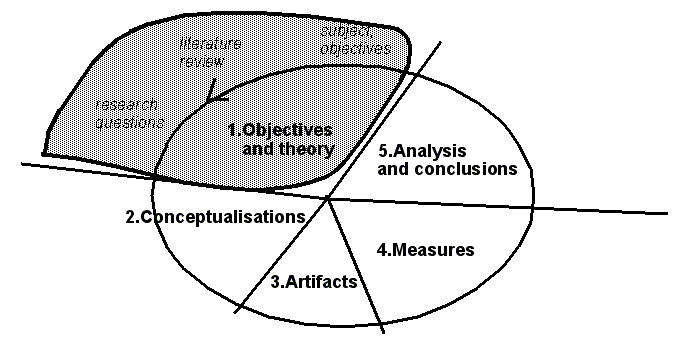
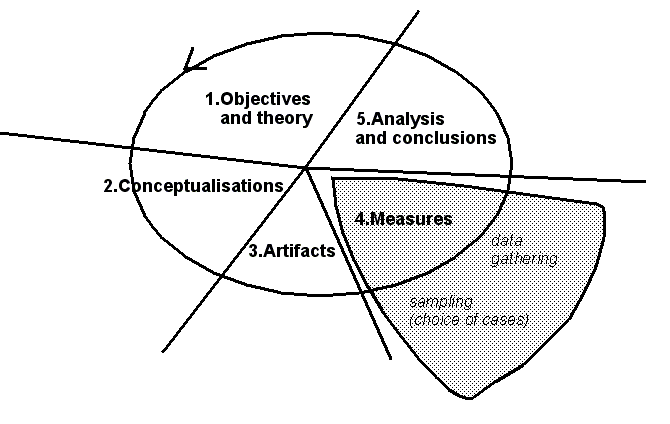
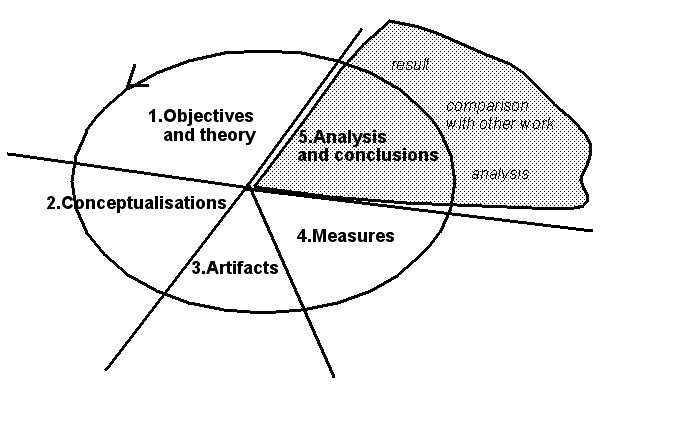
Details of a given research cycle may considerably change within a different approaches. However, most research should start with a an activity that aims to define precise research questions through both a review of the literature and reflections about the objectives. We shall come back to these issues in this and later modules.
Key elements of empirical research
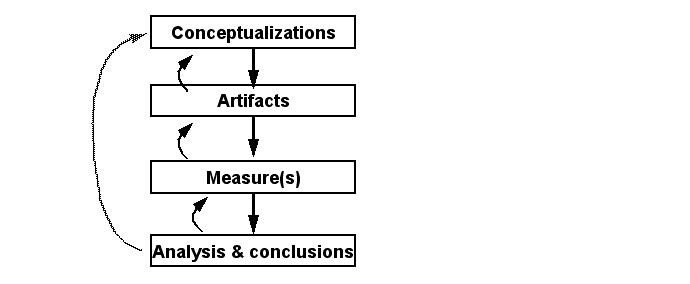
For a given research question, you usually have to do:
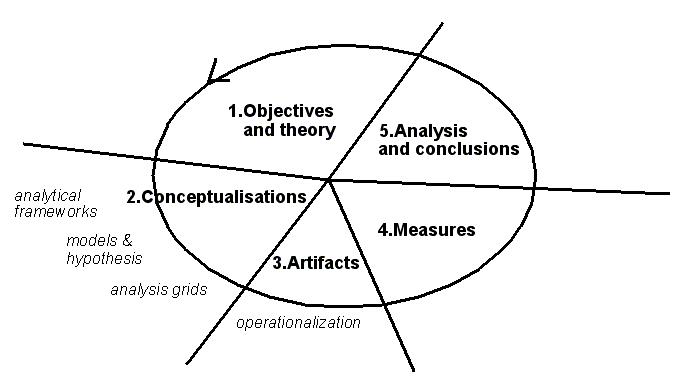
- What we call conceptualizations: make questions explicit, identify major concepts (variables), define terms and their dimensions, find analysis grids, define hypothesis, etc,
- Develop Artifacts : develop research materials (experiments, surveys), implement software, implement designs in the field, etc. Artifacts can be made just for research purposes (e.g. in experimental research) or for "real" purposes (e.g. a computer-supported learning environment for a precise training need)
- Do Measures : Observe (measure) in the field or through experiments. Use your artifacts in various ways)
- Do Analysis & conclusion : Analyze the measures (statistic or qualitative) and link to theoretical statements (e.g. operational research questions and hypothesis). Finally finish writing it up.
Objectives
Now let's start looking at research objectives, i.e. the starting point of a research project. The essence of your research objectives should be formulated in terms of clear research questions.
Research questions are the result of:
- your initial objectives (which you may have to revise)
- a (first) review of the literature
Everything you plan to do, must be formulated as a research question !
See Methodology tutorial - finding a research subject, where we will elaborate this question in some more detail
Conceptualizations
Under the umbrella "conceptualizations" we define a whole lot of intellectual instruments that help you organize theoretical and practical knowledge about your research subject.
So one of your first task is find, elaborate and "massage" some concepts so that they can be used to study observable phenomena. Some of these concepts may globally determine how you look things, others are more like explanatory or to be explained variables.
We shall come back to this issue in the Methodology tutorial - conceptual frameworks and just provide a few examples here.
The usefulness of analysis frameworks
Analysis frameworks help you look a things.
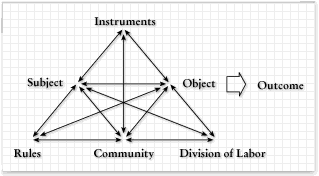
One popular framework in educational technology research is activity theory which has its roots in what could be called soviet micro-sociology.
Quote: The Activity Triangle Model or activity system representationally outlines the various components of an activity system into a unified whole. Participants in an activity are portrayed as subjects interacting with objects to achieve desired outcomes. In the meanwhile, human interactions with each other and with objects of the environment are mediated through the use of tools, rules and division of labor. Mediators represent the nature of relationships that exist within and between participants of an activity in a given community of practices. This approach to modelling various aspects of human activity draws the researcher s attention to factors to consider when developing a learning system. However, activity theory does not include a theory of learning, (Daisy Mwanza & Yrjö Engeström)
Translation: It helps us thinking about the working of an organization (including its actors and processes) and therefore how to study it.
![]() Such a framework is not true or false, just useful (or useless) for a given intellectual task !
Such a framework is not true or false, just useful (or useless) for a given intellectual task !
Hypothesis and operationalizations
Models and hypothesis are important in theory-driven research, e.g. experimental learning theory.
- These constructions link concepts-as-variables and they postulate causalities
- Causalities between theoretical variables do not "exist" per se, they only can be observed indirectly. Working with hypothesis will need operationalization as we shall see.
- Typical statements: "More X leads to more Y", "an increase in X leads to a decrease in Y
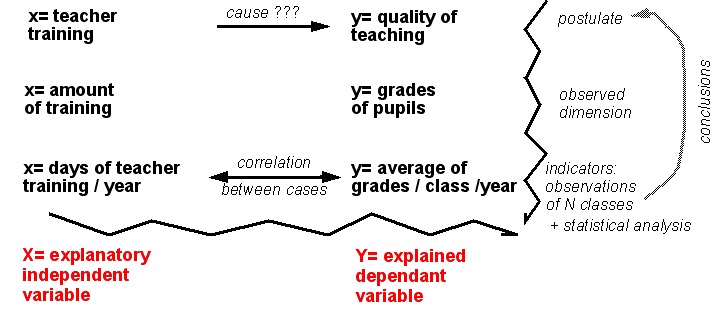
Example: Imagine a research question that aims to know whether there is a causality between teacher training and quality of teaching. In empirical research such a research questions would be formulated as a hypothesis that then can be tested.
An often head hypothesis would state the following:
- Continuous teacher training (cause X) improves teaching (effect Y)
In the picture below we can show the following principles:
- As a starting point we need a causal hypothesis (the postulate)
- We then have to think how to measure each of the two concepts with observable data. E.g. teacher training could be measured by the "amount of training" and quality of teaching by "grades of pupils".
- However, this operationalization is not enough. At some point we have to be more precise, e.g. state that "amount of training" will be measured by "days of training received in one year".
We shall come back later to this central concept of operationalization. The point here was to show that hypothesis should be formulated firstly at a conceptual level. They they need to be rephrased to become operational, i.e. applicable to real data.
The importance of difference (variance) for explanations
Before we further look into this operationalization issue, we need to introduce the "variance" concept. Variance means that things can be different, e.g. teachers can receive {none, little, some, a lot, ...} of training. So we got a variable "amount of teacher training" that can have different values (none, little, etc.). If we can find this variety of values in observations we have variance. If all teachers receive some training we don't have variance. Research needs variance. Without variance (no differences) we can't explain things.
Further more we need co-variance. Since empirical research wants to find out why things exist, we must observe explaining things that have "more" and "less" and how they impact on things to be explained that have "more or less". In other words, without co-variance ... no explanation.
Let's explain this principle with two examples
- (1) Quantitative example
- We got different grade averages and different training days
- therefore variance for both variables
- According to these data: increased training days lead to lower averages
- (consider this hypothetical example false please !)
- (2) Qualitative example
Imagine that we wish to know why certain private schools introduce technology faster than others. One hypothesis to test could be: "Reforms happens when there is external pressure". So we have two variables (and according values)
- reforms (happen, don't happen)
- pressure (internal, external)
To operationalize these variables we use written traces for "pressure" and observable actions for "reforms".
| Strategies of a school | ||||
|---|---|---|---|---|
| Type of pressure | strategy 1:no reaction | strategy 2:a task force is created | strategy 3:internal training programs are created | strategy 4:resources are reallocated |
| Letters written by parents | (N=8) (p=0.8) | (N=2) (p=0.2) | ||
| Letters written by supervisory boards | (N=4) (p=0.4) | (N=5) (p=0.5) | (N=1) (p=0.1) | |
| newspaper articles | (N=1) (p=20%) | (N=4) (p=80%) | ||
N = number of observations, p = probability
The result of (imaginary) research is: Increased pressure leads to increased action. Data for example tells that:
- If letters are written by parents (internal pressure), the probability is 80% that nothing will happen
- If a newspaper article is written, the probability is 80% that resources are reallocated.
Of course, such results have to interpreted carefully and for various reasons, but we shall come back to these validity issues in some other tutorial module.
The operationalization of general concepts
Now let's address the operationalization issue in more depth, since this is a very important issue in empirical research.
A scientific proposition contains concepts (theoretical variables)
- Examples: “the learner”, “performance”, “efficiency”, “interactivity”
An academic research paper links concepts and and empirical paper grounds these links with data.
- ... empirical research requires that you work with data, find indicators, build indices,
- because we observe correlations in some data we can make statements at the theory level
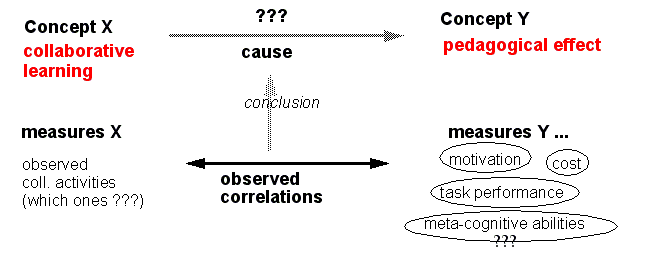
- Example
- Collaborative learning improves pedagogical effect:
We got a real problem here ! How could we measure "pedagogical effect" or "collaborative learning" ? Finding good measures is not trivial.
The bridge/gap between a theoretical concept and measures
There are 2 issues you must address if you want to minimize the (unavoidable gap) between theoretical variables and variables that you can observe.
- (1) Going from 'abstract' to the 'concrete' (theoretical concept - observables)
Examples:
- You could measure “student participation” with “number of forum messages posted”
- You could measure “pedagogical success” with “grade average of a class in exams”
- (2) Going from the 'whole' to 'parts' (dimensions)
Examples from educational design, i.e. dimensions you might consider when you plan to measure the socio-constructiveness of some teaching:
- Decomposition of “socio-constructivist design” in (1) active or constructive learning, (2) self-directed learning, (3) contextual learning and (4) collaborative learning, (5) teacher’s interpersonal behavior (Dolmans et. al)
- The 5e Learning cycle socio-constructivist teaching model: "Socio-constructivist teaching" is composed of Engagement, Exploration, Explanation, Elaboration and Evaluation.
Example from public policy analysis:
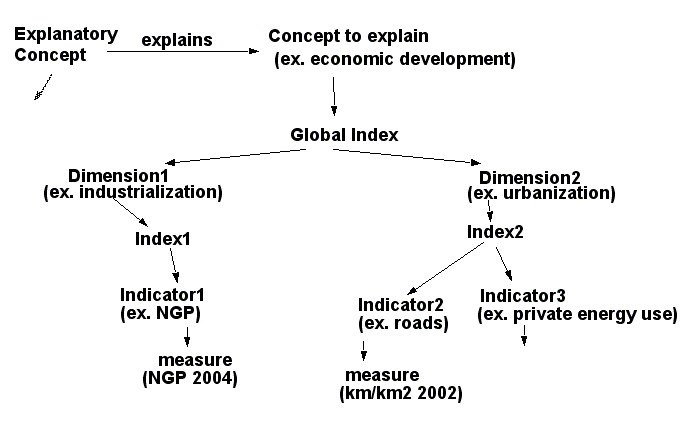
- Decomposition of “economic development” in industrialization, urbanization, transports, communications and education.
Example from HCI:
- Decomposition of usability in "cognitive usability" (what you can achieve with the software) and "simple usability" (can you navigate, find buttons, etc.)
Review questions: Try to decompose a concept you find interesting or think about the usefulness of decompositions presented above.
Example: COLLES questionnaire
Taylor and Maor (2000) developed an instrument to study on-line environments called the "Constructivist On-Line Learning Environment Survey (COLLES) questionnaire and it is available on-line.
This survey instruments allows to “to monitor the extent to which we are able to exploit the interactive capacity of the World Wide Web for engaging students in dynamic learning practices.”. The key qualities (dimensions) this survey can measure are:
- Relevance: How relevant is on-line learning to students' professional practices?
- Reflection: Does on-line learning stimulate students' critical reflective thinking?
- Interactivity: To what extent do students engage on-line in rich educative dialogue?
- Tutor Support: How well do tutors enable students to participate in on-line learning?
- Peer Support: Is sensitive and encouraging support provided on-line by fellow students?
- Interpretation: Do students and tutors make good sense of each other's on-line communications?
Each of these dimensions is then measured with a few survey questions (items), e.g.:
| Statements | Almost Never | Seldom | Some-times | Often | Almost Always |
|---|---|---|---|---|---|
| Items concerning relevance | |||||
| my learning focuses on issues that interest me. | O | O | O | O | O |
| what I learn is important for my professional practice as a trainer. | O | O | O | O | O |
| I learn how to improve my professional practice as a trainer. | O | O | O | O | O |
| what I learn connects well with my prof. practice as a trainer. | O | O | O | O | O |
| Items concerning reflection | |||||
| ... I think critically about how I learn. | O | O | O | O | O |
| ... I think critically about my own ideas. | O | O | O | O | O |
| ... I think critically about other students' ideas. | O | O | O | O | O |
| ... I think critically about ideas in the readings. | O | O | O | O | O |
Example: The measure of economic development
In the diagram below we shortly picture how one could envision to measure economic development with official statistics (only part of the diagram is shown).
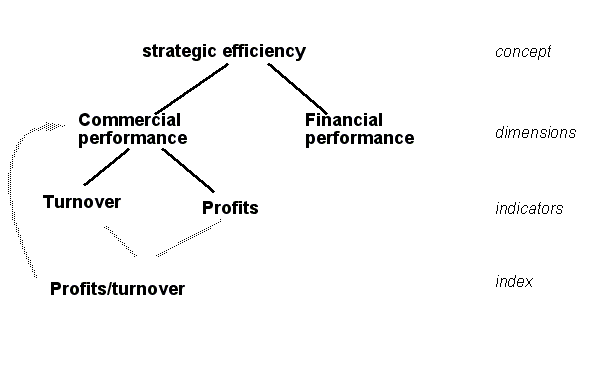
Example: strategic efficiency of a private distance teaching agency
- This example was taken from a french methodology text book (Thiétard, 1999)
Dangers and problems of concept operationalization
Let's summarize this section on concept operationalization. There are a few issues you critically should think about.
- The Gap between data and theory
- Example: measure communication within a community of practice (e.g. an e-learning group) by the quantity of exchanged forum messages
- (students may use other channels to communicate !)
- You may have forgotten a dimension
- example: measure classroom usage of technology only by looking at the technology the teacher uses e.g. power-point, demonstrations with simulation software or math. software
- ( you don’t take into account technology enhanced student activities )
- There could be concept overloading
- example: Include “education” in the definition of development (it could be done, but at the same you will loose an important explanatory variable for development, e.g. consider India’s strategy that "over-invested" in education with the goal to influence on development)
- Therefore: never ever collapse explanatory and explainable variables into one concept !!
- Bad measures, i.e. the kind of data you are looking at do not really measure the concept
- (We will come back later to this "construct validity" issue)
The measure
With somewhat operationalized research questions (and that may include operational hypothesis) you then have to think carefully what kinds of data you will observe and also at which cases (population) you will look at.
Measuring means:
- observe properties, attributes, behaviors, etc.
- select the cases you study (sampling)
Sampling
Sampling refers to the process of selecting "cases", e.g. people, activities, situations etc. you plan to look at. Theses cases should be representative of the whole. E.g. in a survey research the 500 person that will answer the questionnaire should represent the whole group of people you are interested in, e.g. all primary teachers in a country, all students of a university, all voters of a state.
As a general rule: Make sure that "operative" variables have good variance, otherwise you can’t make any statements on causality or difference.
We define operative variables as dependant (to explain) plus independent (explaining) variables.
Sampling in quantitative research is relatively simple. You just select a sufficiently large amount of cases within a given mother population (the one that your theory is about). The best sampling strategy is to randomly select a pool from the mother population, but the difficulty is to identify all the members of the mother population and to have them participate. We will address this issue again in Methodology tutorial - quantitative data acquisition methods.
Sampling can be more complex in qualitative research. Here is a short overview of sampling strategies you might use. More will be mentioned in Methodology tutorial - qualitative data acquisition methods
| Type of selected cases | Usage |
|---|---|
| maximal variation | will give better scope to your result (but needs more complex models, you have to control more intervening variables, etc. !!) |
| homogeneous | provides better focus and conclusions; will be "safer" since it will be easier to identify explaining variables and to test relations |
| critical | exemplify a theory with a "natural" example |
| according to theory, i.e. your research questions |
will give you better guarantees that you will be able to answer your questions .... |
| extremes and deviant cases | test the boundaries of your explanations, seek new adventures |
| intense | complete a quantitative study with an in-depth study |
- sampling strategies depend a lot on your research design !
Measurement techniques
Let's now look for the first time at what we mean by data. There are not only numbers, but also text, photos and videos ! However, we will not discuss details here, see the modules:
- Methodology tutorial - quantitative data acquisition methods
- Methodology tutorial - qualitative data acquisition methods
Below is a table with the principal forms of data collection (also called data acquisition).
|
Articulation | |||
|---|---|---|---|
|
Situation |
non-verbal |
verbal | |
|
oral |
written | ||
|
informal |
participatory observation |
information interview. |
text analysis,log files analysis,etc. |
|
formal and |
systematic observation |
open interviews,semi-structured interviews,thinking aloud protocols,etc. |
open questionnaire,journals, vignettes, |
|
formal and structured |
experiment simulation |
standardized interview, |
standardized questionnaire,log files of structured user interactions, |
Reliability of measure
Let's introduce the reliability principle.
Reliability is the degree of measurement consistency for the same object:
- by different observers
- by the same observer at different moments
- by the same observer with (moderately) different tools
Example: measure of boiling water
- A thermometer always shows 92 C. => it is reliable (but not construction valid)
- The other gives between 99 and 101 C.: => not too reliable (but valid)
Sub-types of reliability (Kirk & Miller):
- circumstantial reliability: even if you always get the same result, it does not means that answers are reliable (e.g. people may lie)
- diachronic reliability: the same kinds of measures still work after time
- synchronic reliability: we obtain similar results by using different techniques, e.g. survey questions and item matching and in depth interviews
The “3 Cs” of an indicator
Reliability also can be understood in some wider sense. Empirical measures are used as or combined into indicators for variables. So "indicator" is just a fancy word for either simple or combined measures.
Anyhow, measures (indicators) can be problematic in various ways and you should look our for the "3 Cs":

Are your data complete ?
- Sometimes you lack data ....
- Try to find other indicators

Are your data correct ?
- The reliability of indicators can be bad.
- Example: Software ratings may not mean the same according to cultures (sub-cultures, organizations, countries) people are more or less outspoken.

Are your data comparable ?
- The meaning of certain data are not comparable.
- Examples:
- (a) School budgets don’t mean the same thing in different countries (different living costs)
- (b) Percentage of student activities in the classroom don’t measure "socio-constructive" sensitivity of a teacher (since there a huge cultural differences between various school systems)
Interpretation: validity (truth) and causality
Having good and reliable measures doesn't guarantee at all that your research is well done in the same that correctly written sentences will not guarantee that a novel is good reading.
The fundamental questions you have to ask are:
- Can you really trust your conclusions ?
- Did you misinterpret statistical evidence for causality ?
These issues are really tricky !
The role of validity
Validity (as well reliability) determine the formal quality of your research. More specifically, validity of your work (e.g. your theory or model) is determined by the validity of its analysis components.
In other words:
- Can you justify your interpretations ??
- Are you sure that you are not a victim of your natural confirmation bias ? (Meaning that people always want their hypothesis to be confirmed at whatever cost)
- Can you really justify causality in a relationship (or should you be more careful and use wordings like "X and Y are related") ?
Validity is not the only quality factor of an empirical research, but it is the most important one. In the table below we show some elements that can be judged and how they are likely to be judged.
| Elements of research | Judgements |
|---|---|
| Theories | usefulness (understanding, explanation, prediction) |
| Models (“frameworks”) | usefulness & construction(relation between theory and data, plus coherence) |
| Hypotheses and models | validity & logic construction (models) |
| Methodology ("approach") | usefulness (to theory and conduct of empirical research) |
| methods | good relation with theory, hypothesis, methodology etc. |
| Data | good relation with hypothesis et models, plus reliability |
![]() A good piece of work satisfies first of all an objective, but it also must be valid.
A good piece of work satisfies first of all an objective, but it also must be valid.
The same message told differently:
- The most important usefulness criteria is: "does it increase our knowledge"
- The most important formal criteria are validity (giving good evidence for causality claims) and reliability (show that measurement, i.e. data gathering is serious.
- Somewhere in between: "Is your work coherent and well constructed" ?
Some reflections on causality
Let's now look a little bit more at causality and that is very much dependant on so-called "internal validity").
Correlations between data don't prove much by themselves ! In particular:
- A correlation between 2 variables (measures) does not prove causality
- Co-occurrence between 2 events does not prove that one leads to the other
The best protection against such errors is theoretical and practical reasoning !
Example: A conclusion that could be made from some superficial data analysis could be the following statement: “We introduced ICT in our school and student satisfaction is much higher”. However, if you think hard you might want to test the alternative hypothesis that it’s maybe not ICT, but just a reorganization effect that had impact on various other variables such as teacher-student relationship, teacher investment, etc.)

If you observe correlations in your data and you are not sure, talk about association and not cause !

Even if can provide sound theoretical evidence for your conclusion, you have the duty to look a rival explanations !
Note: there are methods to test rival explanations (see modules on data-analysis)
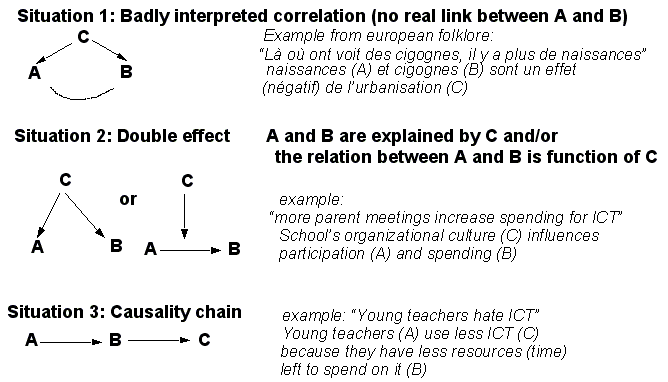
Some examples of bad inference
Below we show some examples of simple hidden causalities.
Of course, there exist quantitative and qualitative methods to test for this ... but just start thinking first !
Conclusion
We end this short introduction into empirical research principles with a short list of advice:
- (1) At every stage of research you have to think and refer to theory
Good analytical frameworks (e.g. instructional design theory or activity theory) will provide structure to your investigation and will allow you to focus on essential things.
- (2) Make a list of all concepts that occur in your research questions and operationalize
You can’t answer your research question without a serious operationalization effort.
Identify major dimensions of concepts involved, use good analysis grids !
- (3) Watch out for validity problems
You can’t prove a hypothesis (you only can test, reinforce, corroborate, etc.).
- Therefore, also look at anti-hypotheses !
Good informal knowledge of a domain will also help. Don’t hesitate to talk about your conclusions with a domain expert
Purely inductive reasoning approaches are difficult and dangerous ... unless you master an adapted (costly) methodology, e.g. "grounded theory"
- (4) Watch our for your “confirmation bias” !
Humans tend to look for facts that confirm their reasoning and ignore contradictory elements. It is your duty to test rival hypothesis (or at least to think about them) !
- (5) Attempt some (but not too much) generalization
Show the others what they can learn from your piece of work , confront your work to other’s !
- (6) Use triangulation of methods, i.e. several ways of looking at the same thing
Different viewpoints (and measures) can consolidate or even refine results. E.g. imagine that you (a) led a quantitative study about teacher’s motivation to use ICT in school or (b) that you administered an evaluation survey form to measure user satisfaction of a piece of software. You then could run a cluster analysis through your data and identify major types of users, e.g. 6 types of teachers or 4 types of users).
Then you could do in-depth interviews with 2 representatives for each type and "dig" into their attitudes, subjective models, abilities, behaviors, etc. and confront these results with your quantitative study.
- (7) Theory creation v.s theory testing
Finally let's recall from the Methodology tutorial - introduction that there exist very different research types. Each of these has certain advantages over the other, e.g.
- qualitative methods are better suited to create new theories (exploration / comprehension)
- quantitative methods are better suited to test / refine theories (explication / prediction)
But:
- Validity, causality, reliability issues ought to be addressed in any piece of research
- It is possible to use several methodological approaches in one piece of work
Bibliography
- Taylor, P. and Maor, D. (2000). Assessing the efficacy of online teaching with the Constructivist On-Line Learning Environment Survey. In A. Herrmann and M.M. Kulski (Eds), Flexible Futures in Tertiary Teaching. Proceedings of the 9th Annual Teaching Learning Forum, 2-4 February 2000. Perth: Curtin University of Technology.
- Taylor, Charles and Maor Dorit, Constructivist On-Line Learning Environment Survey (COLLES) questionnaire: http://surveylearning.moodle.com/colles/ , retrieved 15:43, 11 August 2007 (MEST)
- Thiétart, R-A. & al. (1999). Méthodes de recherche en management, Dunod, Paris.
See Research methodology resources for web links and a general larger bibliography.
