R
R 3.0.2 (2013/09/09)
Developed by: R Foundation and community
License: GPL / GNU General Public License
Web page : Tool homepage
Tool type :
The last edition of this page was on: 2014/02/27
The Completion level of this page is : Low
The last edition of this page was on: 2014/02/27 The Completion level of this page is : Low
SHORT DESCRIPTION
[[has description::R is a language and environment for statistical computing and graphics. It is a GNU project which is similar to the S language and environment which was developed at Bell Laboratories (formerly AT&T, now Lucent Technologies) by John Chambers and colleagues. R can be considered as a different implementation of S. There are some important differences, but much code written for S runs unaltered under R.
R provides a wide variety of statistical (linear and nonlinear modelling, classical statistical tests, time-series analysis, classification, clustering, ...) and graphical techniques, and is highly extensible.
R is available as Free Software for data manipulation, calculation and graphical display. It includes
- an effective data handling and storage facility,
- a suite of operators for calculations on arrays, in particular matrices,
- a large, coherent, integrated collection of intermediate tools for data analysis,
- graphical facilities for data analysis and display either on-screen or on hardcopy, and
- a well-developed, simple and effective programming language which includes conditionals, loops, user-defined recursive functions and input and output facilities.
R can be considered as an environment within which statistical techniques are implemented. R can be extended via packages. For example, try:
TOOL CHARACTERISTICS
Usability
Tool orientation
Data mining type
Manipulation type
IMPORT FORMAT :
EXPORT FORMAT :
| Tool objective(s) in the field of Learning Sciences | |
|
☑ Analysis & Visualisation of data |
☑ Providing feedback for supporting instructors: |
Tool can perform:
- Data extraction of type:
- Transformation of type: Simple data transformation operations, Mathematical transformation of data for analysis
- Data analysis of type: Basic statistics and data summarization, Data mining methods and algorithms
- Data visualisation of type: Sequential Graphic, Chart/Diagram (These visualisations can be interactive and updated in "real time")
ABOUT USERS
Tool is suitable for:
Required skills:
STATISTICS: Advanced
PROGRAMMING: Basic
SYSTEM ADMINISTRATION: None
DATA MINING MODELS: Advanced
FREE TEXT
| Tool version : R 3.0.2 2013/09/09 (blank line) Developed by : R Foundation and community | 
|
SHORT DESCRIPTION
R is a language and environment for statistical computing and graphics. It is a GNU project which is similar to the S language and environment which was developed at Bell Laboratories (formerly AT&T, now Lucent Technologies) by John Chambers and colleagues. R can be considered as a different implementation of S. There are some important differences, but much code written for S runs unaltered under R.
R provides a wide variety of statistical (linear and nonlinear modelling, classical statistical tests, time-series analysis, classification, clustering, ...) and graphical techniques, and is highly extensible.
R is available as Free Software for data manipulation, calculation and graphical display. It includes
- an effective data handling and storage facility,
- a suite of operators for calculations on arrays, in particular matrices,
- a large, coherent, integrated collection of intermediate tools for data analysis,
- graphical facilities for data analysis and display either on-screen or on hardcopy, and
- a well-developed, simple and effective programming language which includes conditionals, loops, user-defined recursive functions and input and output facilities.
R can be considered as an environment within which statistical techniques are implemented. R can be extended via packages. For example, try:
TOOL CHARACTERISTICS
| Tool orientation | Data mining type | Usability |
|---|---|---|
| This tool is designed for general purpose analysis. | This tool is designed for . | Authors of this page consider that this tool is somewhat difficult to use. |
| Data import format | Data export format |
|---|---|
| . | . |
| Tool objective(s) in the field of Learning Sciences | |
|
☑ Analysis & Visualisation of data |
☑ Providing feedback for supporting instructors: |
Can perform data extraction of type:
Can perform data transformation of type:
Simple data transformation operations, Mathematical transformation of data for analysis
Can perform data analysis of type:
Basic statistics and data summarization, Data mining methods and algorithms
Can perform data visualisation of type:
Sequential Graphic, Chart/Diagram (These visualisations can be interactive and updated in "real time")
ABOUT USER
| Tool is suitable for: | ||||
| Students/Learners/Consumers:☑ | Teachers/Tutors/Managers:☑ | Researchers:☑ | Organisations/Institutions/Firms:☑ | Others:☑ |
| Required skills: | |||
| Statistics: ADVANCED | Programming: BASIC | System administration: NONE | Data mining models: ADVANCED |
OTHER TOOL INFORMATION

|
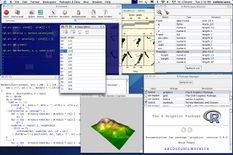
| RAqua-scrshot1.jpg |
| Rlogo.jpg |
| R |
| GPL / GNU General Public License |
| Free&Open source |
| R Foundation and community |
| 2013/09/09 |
| 3.0.2 |
| http://www.r-project.org/ |
| [[has description::R is a language and environment for statistical computing and graphics. It is a GNU project which is similar to the S language and environment which was developed at Bell Laboratories (formerly AT&T, now Lucent Technologies) by John Chambers and colleagues. R can be considered as a different implementation of S. There are some important differences, but much code written for S runs unaltered under R.
R provides a wide variety of statistical (linear and nonlinear modelling, classical statistical tests, time-series analysis, classification, clustering, ...) and graphical techniques, and is highly extensible. R is available as Free Software for data manipulation, calculation and graphical display. It includes
R can be considered as an environment within which statistical techniques are implemented. R can be extended via packages. For example, try: |
| General analysis |
| Advanced |
| Basic |
| None |
| Advanced |
| Data transformation, Data analysis, Data visualisation |
| Basic statistics and data summarization, Data mining methods and algorithms |
| Simple data transformation operations, Mathematical transformation of data for analysis |
| Sequential Graphic, Chart/Diagram |
| somewhat difficult to use |
| Low |

