Methodology tutorial - exploratory data analysis: Difference between revisions
m (using an external editor) |
No edit summary |
||
| Line 121: | Line 121: | ||
[[Category: research methodologies]] | [[Category: research methodologies]] | ||
[[Category: tutorials]] | [[Category:Research methodology tutorials]] | ||
Revision as of 15:11, 4 August 2009
This article or section is currently under construction
In principle, someone is working on it and there should be a better version in a not so distant future.
If you want to modify this page, please discuss it with the person working on it (see the "history")
<pageby nominor="false" comments="false"/>
This is part of the methodology tutorial (see its table of contents).
Introduction
This tutorial will provide a short introduction to exploratory data analysis (EDA), multi-variate data reduction and related subjects. We will focus on:
- Looking at distributions
- Uncovering structure (both in variables and population)
There exist many techniques, here we plan (to be confirmed!) boxplots, cluster analysis and Factor Analysis (principal components).
- Learning goals
- Be able to select a procedure for exploratory data analysis
- ........
- Prerequisites
- Moving on
- none
- Level and target population
- Beginners
- Quality
- Under construction , use with care !!
We will use data from the PISA 2006 study, i.e. from the
Exploratory statistics
Exploratory data analysis can be defined as a set of techniques but also as a spirit.
According to NIST handbook,
exploratory Data Analysis (EDA) is an approach/philosophy for data analysis that employs a variety of techniques (mostly graphical) to
- 1. maximize insight into a data set;
- 2. uncover underlying structure;
- 3. extract important variables;
- 4. detect outliers and anomalies;
- 5. test underlying assumptions;
- 6. develop parsimonious models; and
- 7. determine optimal factor settings.
According to Wikipedia and referring to Tukey,
the objectives of EDA are to:
- Suggest hypotheses about the causes of observed phenomena
- Assess assumptions on which statistical inference will be based
- Support the selection of appropriate statistical tools and techniques
- Provide a basis for further data collection through surveys or experiments
Data reduction techniques
Use of simple descriptive statistics
Summary tables
Boxplots
Cluster Analysis
- Cluster analysis or classification refers to a set of multivariate methods for grouping elements (subjects or variables) from some finite set into clusters of similar elements (subjects or variables).
- There different kinds of cluster analysis. The most popular are : hierarchical cluster analysis and K-means cluster.
Typical use case examples: Classify teachers into 4 to 6 different groups regarding ICT usage
- Hierarchical cluster analysis
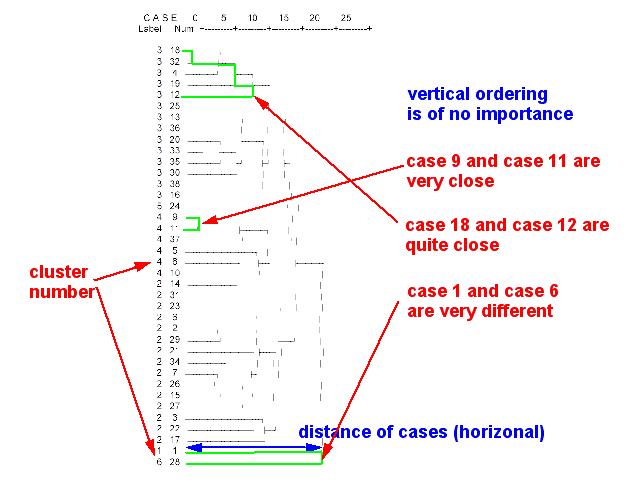
Tries to identify similar cases in progressive steps. This procedure allows to produce a dendogram (tree diagram of the population)
- Example
- classification of teachers
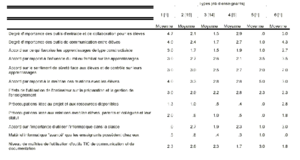
- A hierarchical analysis of 36 survey variables allowed to identify 6 major types of teachers with respect to ICT use:
- Type 1 : The "convinced teacher" (l’enseignant convaincu)
- Type 2 : The "active teacher" (les enseignants actifs)
- Type 3 : The "motivated teacher working within a bad environment" (les enseignants motivés ne disposant pas d’un environnement favorable)
- Type 4 : The "willing but not ICT-compentent teacher" (les enseignants volontaires, mais faibles dans le domaine des technologies(
- Type 5 : The "ICT-competent teacher unwilling to use ICT in the class" (l’enseignant techniquement fort mais peu actif en TIC)
- Type 6 : The "Willing and relatively weak in ICT teacher" (l’enseignant à l’aise malgré un niveau moyen de maîtrise)
In order to come up with such labels like "convinced teacher" you have to list the means of all cluster variables and use your imagination.
(sorry this is hardly readable)
Principal component analysis
Links and references
- Online pages
- Exploratory data analysis (Wikipedia)
- Online handbooks
- NIST/SEMATECH e-Handbook of Statistical Methods Exploratory Data Analysis, retrieved 18:35, 5 March 2009 (UTC)
- Books
- Tukey, John Wilder (1977). Exploratory Data Analysis. Addison-Wesley. ISBN 0-201-07616-0.
- Data
To do
- Data visualization

