System Dynamics (FreeStyler): Difference between revisions
| Line 50: | Line 50: | ||
* PredationRate (moderated by an efficiency rate) defines what mice percentage of mice * cats will be killed mice. One cat for 100 mice will kill little, but 10 cats for 100 mice much more. | * PredationRate (moderated by an efficiency rate) defines what mice percentage of mice * cats will be killed mice. One cat for 100 mice will kill little, but 10 cats for 100 mice much more. | ||
This model still needs improvement, e.g. we should simulate food for mice, i.e. the effect of population density. Also, cat population could also be modeled by starvation. Right now, the mouse population only affects the birth rate of cats. | |||
== Bibliography == | |||
[[category:simulation environments]] | [[category:simulation environments]] | ||
Revision as of 14:41, 11 March 2019
This article shortly documents the system dynamics plugin for the Freestyler software. As of Feb 2019 the program is still working under Windows §10 and Ubuntu 10. However, it requires some extra installation efforts described in the Freestyler article. Also, mouse behavior is fairly erratic which is probably due to the fact that Java programs age very badly, even if adapted for the latest Java Runtime. Anyhow, apart from these shortcomings, the program does its job and in addition runs within an environment that includes other interesting educational applications.
Read also:
The system dynamics palette
The system dynamics palette allows creating system dynamics models from the following graphical elements:
- Stocks
- Rates (i.e. in/out flows)
- Constants (numbers)
- Flow Edges to connect rates and stocks
- Information Edges to connect Constants with Rates. Constants cannot connect to each other. Therefore all equations must be defined within the rate boxes.
Examples
Simulating a single stock growth
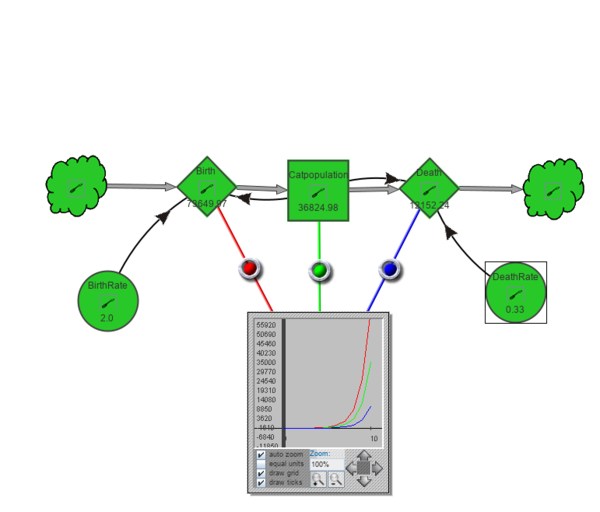
The following example (badly) models a system for cat growth, using yearly increase:
- We start with a population of two cats
- Birth rate is 2 / year, i.e. on average a couple of cats produces 4 cats / year
- Death rate is 0.33 / year, i.e. on average one out of three cats dies every year.
After 10 years we got almost 36'000 cats. That is impressive. A real model would include food for cats (e.g. mice) and food for mice (e.g. grass) and interactions between these variables. For example, cats starve without mice, mice would eat all the grass if not eaten by cats and starve too.
Simulating the interaction between two population
The following model taken from a NetLogo library [1] simulates growth of mice and cat populations with so-called Lotka-Volterra equations.
- Cat birth are influenced by the number of mice
- Mice death by the number of cats
The following picture shows the popup when clicking on "Births".
Since four variables are connected to this rate, we then can type the simple equation:
Births = Efficiency * CatPop * MicePop * PredationRate.
Mouse Death = CatPop * MicePop * PredationRate.
- PredationRate (moderated by an efficiency rate) defines what mice percentage of mice * cats will be killed mice. One cat for 100 mice will kill little, but 10 cats for 100 mice much more.
This model still needs improvement, e.g. we should simulate food for mice, i.e. the effect of population density. Also, cat population could also be modeled by starvation. Right now, the mouse population only affects the birth rate of cats.
Bibliography
- ↑ Wilensky, U. (2005). NetLogo Wolf Sheep Predation (System Dynamics) model. http://ccl.northwestern.edu/netlogo/models/WolfSheepPredation(SystemDynamics). Center for Connected Learning and Computer-Based Modeling, Northwestern University, Evanston, IL.


