RapidMiner Studio: Difference between revisions
Jump to navigation
Jump to search
| (24 intermediate revisions by 2 users not shown) | |||
| Line 16: | Line 16: | ||
In a few words, RapidMiner Studio is a "downloadable GUI for machine learning, data mining, text mining, predictive analytics and business analytics". It can also be used (for most purposes) in batch mode (command line mode). | In a few words, RapidMiner Studio is a "downloadable GUI for machine learning, data mining, text mining, predictive analytics and business analytics". It can also be used (for most purposes) in batch mode (command line mode). | ||
[[User:Camacab0|Camacab0]] ([[User talk:Camacab0|talk]] | [[User:Camacab0|Camacab0]] ([[User talk:Camacab0|talk]]) | ||
|field_analysis_orientation=General analysis | |field_analysis_orientation=General analysis | ||
|field_data_analysis_objective= | |field_data_analysis_objective= | ||
| Line 57: | Line 57: | ||
First of all, it is important to say that RapidMiner Studio - and RapidMiner Server, that work with it - are a complete set of tools, rather than a more specific software. [https://rapidminer.com/ RapidMiner website] says that "RapidMiner lets you easily sort through and run more than 1500 operations". | First of all, it is important to say that RapidMiner Studio - and RapidMiner Server, that work with it - are a complete set of tools, rather than a more specific software. [https://rapidminer.com/ RapidMiner website] says that "RapidMiner lets you easily sort through and run more than 1500 operations". | ||
Because of it's complexity, i will only describe some of RapidMiner Studio's functions. However, I will show above an use example of RapidMiner Studio as a basic text miner. RapidMiner Studio's highlights are : | Because of it's complexity, i will only describe some of RapidMiner Studio's functions. However, I will show above an use example of RapidMiner Studio as a basic text miner. Then, I will show you how to use RapidMiner to extract, transform and analyze tweets. | ||
RapidMiner Studio's highlights are : | |||
* A visual - code-free - environment, so no programming needed | * A visual - code-free - environment, so no programming needed | ||
| Line 74: | Line 76: | ||
= Use examples = | = Use examples = | ||
As we can do almost anything with RapidMiner Studio, I choosed to explore two different activities that can help you later build a text-mining and analyzing project. | |||
First, I will show you how to use RapidMiner as a basic text-mining tool. We will see how to extract, transform and analyze text from files on your computer. | |||
Secondly, I will explain how you can analyze tweets for free with RapidMiner Studio and a third-party website for Tweeter extraction (that is a premium feature of RapidMiner Studio). | |||
== Basic text mining == | == Basic text mining == | ||
| Line 125: | Line 131: | ||
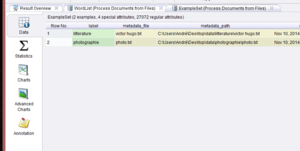
If you launch the process leaving the default value (TF-IDF), RapidMiner will present you the results in different ways. First you have two tabs, '''WordList''' and '''ExampleSet'''. | If you launch the process leaving the default value (TF-IDF), RapidMiner will present you the results in different ways. First you have two tabs, '''WordList''' and '''ExampleSet'''. | ||
Note : TF-IDF is a "short for term frequency–inverse document frequency" which is "a numerical statistic that is intended to reflect how important a word is to a document in a collection or corpus." [http://fr.wikipedia.org/wiki/TF-IDF Wikipedia] | |||
==== WordList View ==== | ==== WordList View ==== | ||
| Line 139: | Line 147: | ||
[[File:RapidMiner_Studio_Tutorial1_I.PNG|300px|thumb|right|Fig. 7 : ExampleSet View]] | [[File:RapidMiner_Studio_Tutorial1_I.PNG|300px|thumb|right|Fig. 7 : ExampleSet View]] | ||
[[File:RapidMiner_Studio_Tutorial1_J.PNG|150px|thumb|left|Fig. 8 : Charts view types]] | [[File:RapidMiner_Studio_Tutorial1_J.PNG|150px|thumb|left|Fig. 8 : Charts view types]] | ||
| Line 165: | Line 174: | ||
=== Tweets extraction === | === Tweets extraction === | ||
[[File:TweetsExtractionWithRapidminer-Figure1.png|thumbnail|right|Zapier's GoogleDrive and Twitter connection]] | |||
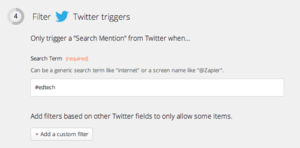
[[File:TweetsExtractionWithRapidminer-Figure2.png|thumbnail|right|Twitter search parameters on Zapier]] | |||
First of all you need to get your data that you want to input in RapidMiner. In our case, we need the tweets that we want to process. As said before, some third-party services allow you to extract tweets automatically from Twitter : I will present [https://zapier.com Zapier], which "''connects the web apps you use to easily move your data and automate tedious tasks''". A zap is a connexion between two services, that you can set up to automate tasks. | First of all you need to get your data that you want to input in RapidMiner. In our case, we need the tweets that we want to process. As said before, some third-party services allow you to extract tweets automatically from Twitter : I will present [https://zapier.com Zapier], which "''connects the web apps you use to easily move your data and automate tedious tasks''". A zap is a connexion between two services, that you can set up to automate tasks. | ||
For our task, I connected Twitter and Google Drive, and specified that I want Zapier to look for an hashtag (#edtech) and to save each tweet containing that value in a new text file, in a Google Drive folder. | For our task, I connected Twitter and Google Drive, and specified that I want Zapier to look for an hashtag (#edtech) and to save each tweet containing that value in a new text file, in a Google Drive folder. | ||
Once you have the relevant amount of tweets, you can save your Google Drive folder in a local place in your computer, that you will specify to RapidMiner. I got nearly 8'000 tweets in a few days. You have now your data ready to start using it with RapidMiner. | Once you have the relevant amount of tweets, you can save your Google Drive folder in a local place in your computer, that you will specify to RapidMiner. I got nearly 8'000 tweets in a few days. You have now your data ready to start using it with RapidMiner. | ||
| Line 180: | Line 187: | ||
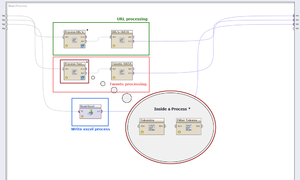
After having all our tweets in a directory on the computer, we can proceed with RapidMiner. We need to make a process that will take our directory as input, and that will output data that can be analysed and visualised. The figure bellow show all my three processes that I will explained bellow. | After having all our tweets in a directory on the computer, we can proceed with RapidMiner. We need to make a process that will take our directory as input, and that will output data that can be analysed and visualised. The figure bellow show all my three processes that I will explained bellow. | ||
[[File:TweetsProcessingWithRapidminer-Figure3.png|thumbnail| | [[File:TweetsProcessingWithRapidminer-Figure3.png|thumbnail|left|RapidMiner process, containing the three sub-processes]] | ||
Let's first focus on the orange process, the '''Tweets processing''' : | Let's first focus on the orange process, the '''Tweets processing''' : | ||
| Line 196: | Line 203: | ||
=== Data analysis === | === Data analysis === | ||
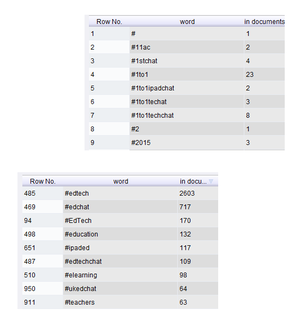
[[File:TweetsAnalysisWithRapidminer-Figure1.png|thumbnail| | [[File:TweetsAnalysisWithRapidminer-Figure1.png|thumbnail|right|Figure 1 - Hashtags (sorted by "in documents" count, and alphabetically)]] | ||
Once the process showed before is complete and valid, you can test it to see if data outputed is what you were waiting for. My process gets me three ExampleSets, as i had three ouput points connected. I will present now two of these ExampleSets and talk then about the third one, the Read Excel process. | Once the process showed before is complete and valid, you can test it to see if data outputed is what you were waiting for. My process gets me three ExampleSets, as i had three ouput points connected. I will present now two of these ExampleSets and talk then about the third one, the Read Excel process. | ||
| Line 202: | Line 209: | ||
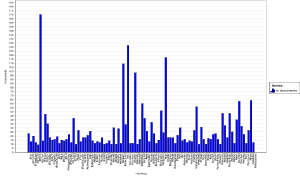
[[File:TweetsAnalysisWithRapidminer-Figure2.svg|thumbnail|right|Figure 2 - Most represented hashtags in a graph (equivalent hashtags and #edchat filtered)]] | [[File:TweetsAnalysisWithRapidminer-Figure2.svg|thumbnail|right|Figure 2 - Most represented hashtags in a graph (equivalent hashtags and #edchat filtered)]] | ||
My first | '''My first process''' had as objective to show which hashtags were represented most, combined with #edtech hashtag. The "Tweets->DATA" ExampleSet show us that. You can see it in a data view (table) which can be sorted and in other ways like charts. | ||
* Figure 1 shows the data view, we can there see all hashtags and the number of documents (tweets) in which they were. | * Figure 1 shows the data view, we can there see all hashtags and the number of documents (tweets) in which they were. | ||
* Figure 2 shows a graphic with most represented hashtags. | * Figure 2 shows a graphic with most represented hashtags. | ||
My last process, read Excel, is the easiest way I found to filter tokens depending on the "In documents" value. As some hashtags like #EdTech, #edTech, #Edtech were some of the most used hashtags, as I didn't used a case sensitive action to remove capital letters, and because de graph wasn't "viewable" due to the huge amount of different hashtags, I needed to filter my final data. I looked how to do it, and tried different ways, but didn't manage to do it. What I did is that I exported the data resulting from my "Tweets->Data" process, in a Microsoft Excel file. I then deleted all unwanted lines (equivalent hashtags and hashtags less represented) to keep only the most used hashtags. I created a process in RapidMiner that reads that file and outputs it's data : I then have filtered data, that can be showed. | '''My last process''', read Excel, is the easiest way I found to filter tokens depending on the "In documents" value. As some hashtags like #EdTech, #edTech, #Edtech were some of the most used hashtags, as I didn't used a case sensitive action to remove capital letters, and because de graph wasn't "viewable" due to the huge amount of different hashtags, I needed to filter my final data. I looked how to do it, and tried different ways, but didn't manage to do it. What I did is that I exported the data resulting from my "Tweets->Data" process, in a Microsoft Excel file. I then deleted all unwanted lines (equivalent hashtags and hashtags less represented) to keep only the most used hashtags. I created a process in RapidMiner that reads that file and outputs it's data : I then have filtered data, that can be showed. | ||
* The figure 2 graphic is the result of the Read Excel process. It only contains the most used hashtags, and filters the "equivalents" hashtags. It is important to say also that the most used hashtag (#edchat) has also been removed to better view of the others hashtags. | * The figure 2 graphic is the result of the Read Excel process. It only contains the most used hashtags, and filters the "equivalents" hashtags. It is important to say also that the most used hashtag (#edchat) has also been removed to better view of the others hashtags. | ||
Finally | Finally, '''my second process''' extracts links from the tweets, to see which kind of content could be behind the most tweeted links. | ||
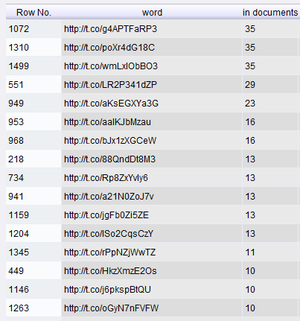
=== URL analysis === | === URL analysis === | ||
| Line 239: | Line 246: | ||
==== Comments ==== | ==== Comments ==== | ||
This process has the main objective of showing how we work with data in RapidMiner. Of course I only explored a very small amount of it's functionalities and strengths. I think that the process that processes tweets could be much better : it could analyse hashtags that are together in a tweet, could analyse how many hashtags are used, on average, in every tweet. | This process has the main objective of showing how we work with data in RapidMiner. Of course I only explored a very small amount of it's functionalities and strengths. I think that the process that processes tweets could be much better : it could analyse hashtags that are together in a tweet, could analyse how many hashtags are used, on average, in every tweet. I could also cross the hashtags represented in #edtech tweets with the ones represented in #edchat tweets for example. | ||
As said before, the process treating links could be more automatised : it could resolve "real domains" automatically, and we would be able then to count or mesure which articles or even domain names (websites) are more represented. | As said before, the process treating links could be more automatised : it could resolve "real domains" automatically, and we would be able then to count or mesure which articles or even domain names (websites) are more represented. | ||


